Technical Analysis of VEEV 2024-05-10
Overview:
In analyzing the technical indicators for VEEV over the last 5 days, we will delve into the trend, momentum, volatility, and volume indicators to provide a comprehensive outlook on the possible stock price movement in the coming days. By examining these key aspects, we aim to offer valuable insights and predictions to guide your investment decisions.
Trend Analysis:
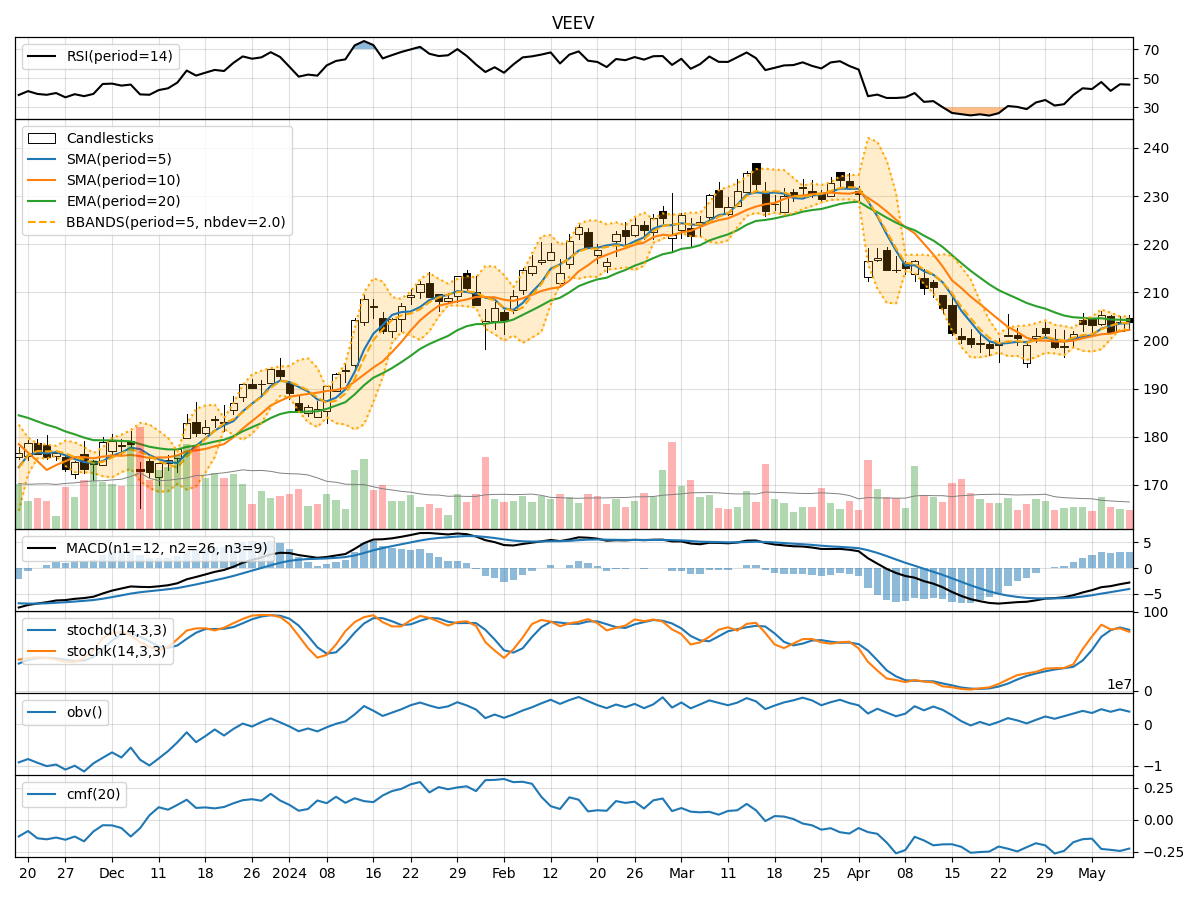
- Moving Averages (MA): The 5-day Moving Average (MA) has been consistently above the Simple Moving Average (SMA) and Exponential Moving Average (EMA), indicating a short-term bullish trend.
- MACD: The Moving Average Convergence Divergence (MACD) has shown a positive trend, with the MACD line consistently above the Signal line, suggesting bullish momentum.
Key Observation: The trend indicators suggest a bullish sentiment in the short term.
Momentum Analysis:
- RSI: The Relative Strength Index (RSI) has been fluctuating around the neutral zone, indicating a balanced momentum.
- Stochastic Oscillator: Both %K and %D have been oscillating within the overbought and oversold levels, reflecting mixed momentum.
Key Observation: The momentum indicators show a lack of clear direction, signaling potential consolidation.
Volatility Analysis:
- Bollinger Bands (BB): The Bollinger Bands have shown a narrowing range, indicating decreasing volatility.
Key Observation: Volatility has been decreasing, suggesting a potential period of consolidation or a breakout.
Volume Analysis:
- On-Balance Volume (OBV): The OBV has been fluctuating, indicating indecision among market participants.
- Chaikin Money Flow (CMF): The CMF has been negative, suggesting selling pressure in the market.
Key Observation: Volume indicators point towards uncertainty and a possible shift in sentiment.
Conclusion:
Based on the analysis of the technical indicators, the next few days for VEEV could see sideways movement with a slight bullish bias. The trend indicators support a short-term bullish outlook, while the momentum indicators suggest a lack of clear direction. The decreasing volatility hints at a potential consolidation phase, while the volume indicators indicate market indecision.
Overall, the stock is likely to trade within a narrow range with a slightly bullish bias, but caution is advised due to the mixed signals from momentum and volume indicators. It is essential to monitor key levels and wait for confirmation before making significant trading decisions.