Technical Analysis of VFC 2024-05-10
Overview:
In analyzing the technical indicators for VFC over the last 5 days, we will delve into the trend, momentum, volatility, and volume indicators to provide a comprehensive outlook on the possible stock price movement in the coming days. By examining these key aspects, we aim to offer valuable insights and recommendations for potential investors.
Trend Analysis:
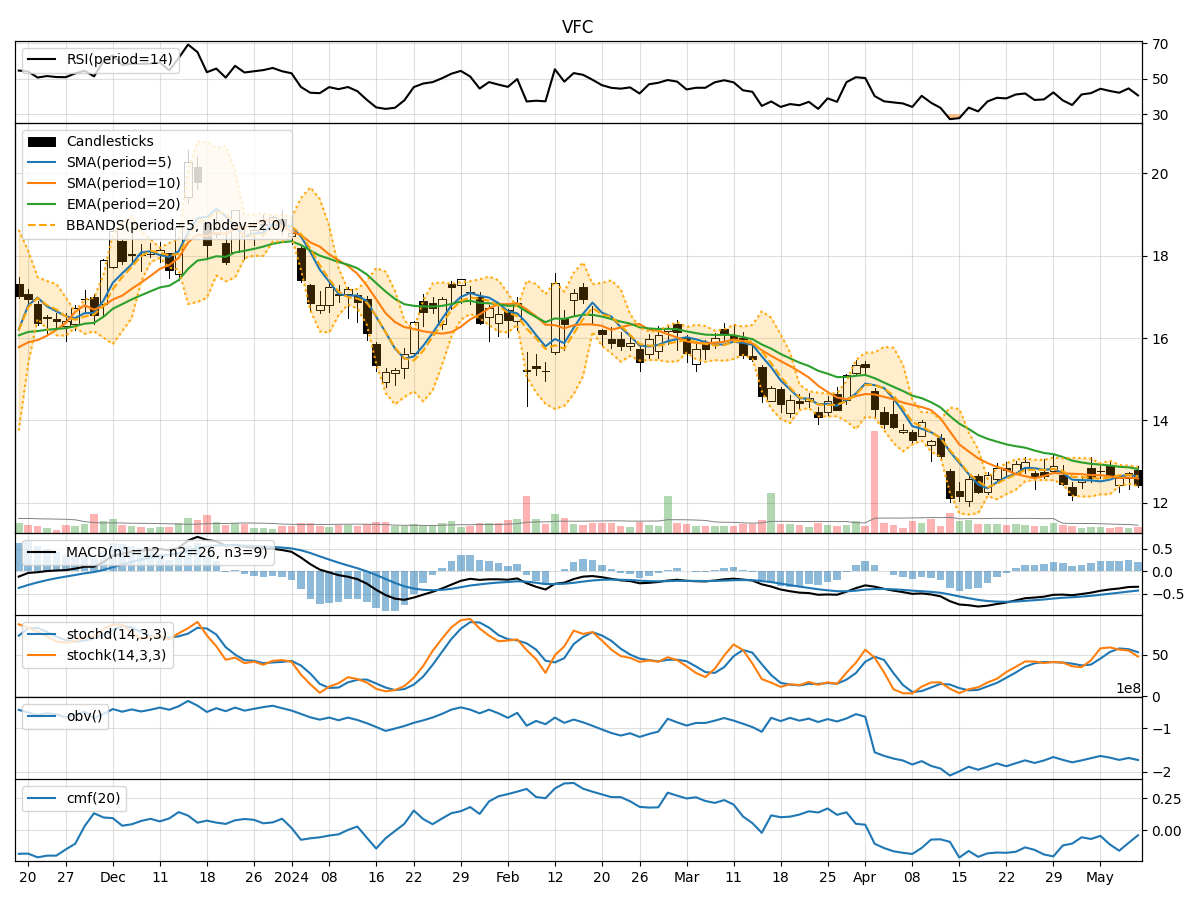
- Moving Averages (MA): The 5-day MA has been fluctuating around the closing prices, indicating short-term price trends. The SMA(10) and EMA(20) are showing a downward trend, suggesting a bearish sentiment in the medium to long term.
- MACD and Signal Line: The MACD has been negative, with the MACD line consistently below the signal line, indicating a bearish trend in momentum.
Momentum Analysis:
- RSI: The RSI values have been fluctuating around the midline, indicating indecision in the market sentiment.
- Stochastic Oscillator: Both %K and %D values have been declining, suggesting a bearish momentum.
- Williams %R: The indicator has been in oversold territory, indicating a potential reversal or continuation of the downtrend.
Volatility Analysis:
- Bollinger Bands: The bands have been narrowing, indicating decreasing volatility in the stock price.
Volume Analysis:
- On-Balance Volume (OBV): The OBV has been declining, suggesting selling pressure in the market.
- Chaikin Money Flow (CMF): The CMF has been negative, indicating a bearish money flow trend.
Key Observations and Opinions:
- Trend: The trend indicators suggest a bearish sentiment in the short to medium term.
- Momentum: Momentum indicators also point towards a bearish outlook with declining values.
- Volatility: Decreasing volatility may indicate a period of consolidation or a potential breakout.
- Volume: The declining OBV and negative CMF signal a bearish sentiment among investors.
Conclusion:
Based on the analysis of the technical indicators, the overall outlook for VFC in the next few days is bearish. The trend, momentum, and volume indicators all point towards a continued downward movement in the stock price. Traders and investors should exercise caution and consider shorting or staying on the sidelines until a clear reversal pattern emerges.