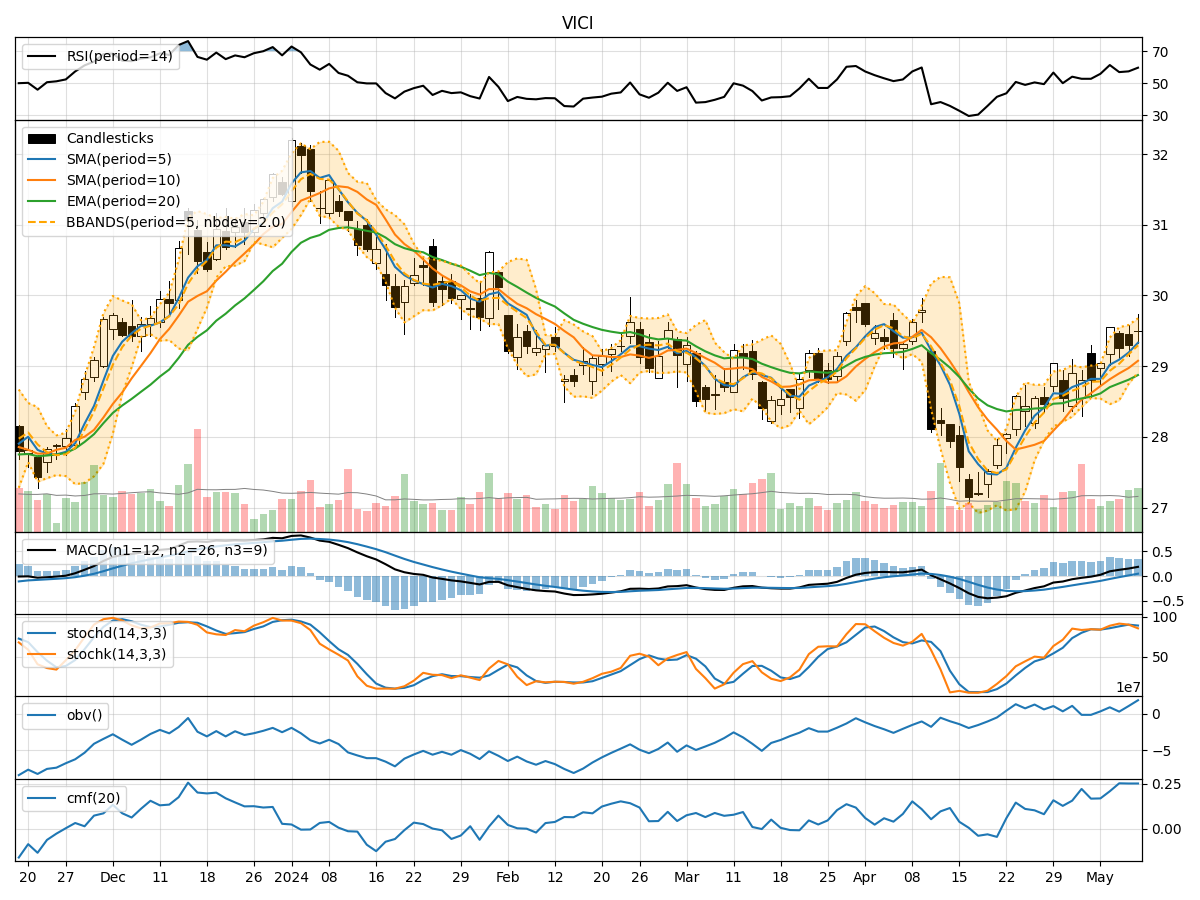
Technical Analysis of VICI 2024-05-10
Overview:
In analyzing the technical indicators for VICI over the last 5 days, we will delve into the trend, momentum, volatility, and volume indicators to provide a comprehensive assessment of the stock's potential price movement. By examining these key factors, we aim to offer insights into the possible future direction of VICI's stock price.
Trend Indicators:
- Moving Averages (MA): The 5-day MA has been consistently above the closing price, indicating a short-term uptrend.
- MACD: The MACD line has been trending upwards, with the MACD histogram showing positive values, suggesting bullish momentum.
- EMA: The EMA has been steadily increasing, reflecting a positive trend in the stock price.
Momentum Indicators:
- RSI: The RSI has been fluctuating in the neutral zone, indicating a balanced momentum without extreme overbought or oversold conditions.
- Stochastic Oscillator: Both %K and %D have been relatively high, suggesting strong buying pressure.
- Williams %R: The indicator has been hovering around oversold territory, potentially signaling a reversal in the short term.
Volatility Indicators:
- Bollinger Bands: The stock price has been trading within the bands, indicating normal volatility levels.
- Bollinger %B: The %B indicator has been fluctuating within the bands, suggesting no extreme overbought or oversold conditions.
Volume Indicators:
- On-Balance Volume (OBV): The OBV has been increasing, indicating accumulation by investors.
- Chaikin Money Flow (CMF): The CMF has been positive, reflecting buying pressure in the stock.
Key Observations:
- The trend indicators suggest a bullish sentiment with moving averages and MACD showing positive trends.
- Momentum indicators indicate a mixed sentiment with RSI in neutral territory and stochastic oscillators showing strong buying pressure.
- Volatility indicators point towards normal price fluctuations without any extreme conditions.
- Volume indicators reflect positive accumulation and buying pressure in the stock.
Conclusion:
Based on the analysis of the technical indicators, the next few days for VICI stock price are likely to see an upward movement. The bullish trend, positive momentum, normal volatility, and buying pressure indicated by the volume indicators all point towards a potential increase in the stock price. Traders and investors may consider taking long positions or holding onto existing positions to capitalize on the expected upward movement in VICI's stock price.