Technical Analysis of VIST 2024-05-10
Overview:
In analyzing the technical indicators for VIST over the last 5 days, we will delve into the trend, momentum, volatility, and volume indicators to provide a comprehensive outlook on the possible stock price movement. By examining these key aspects, we aim to offer valuable insights and predictions for the upcoming days.
Trend Indicators:
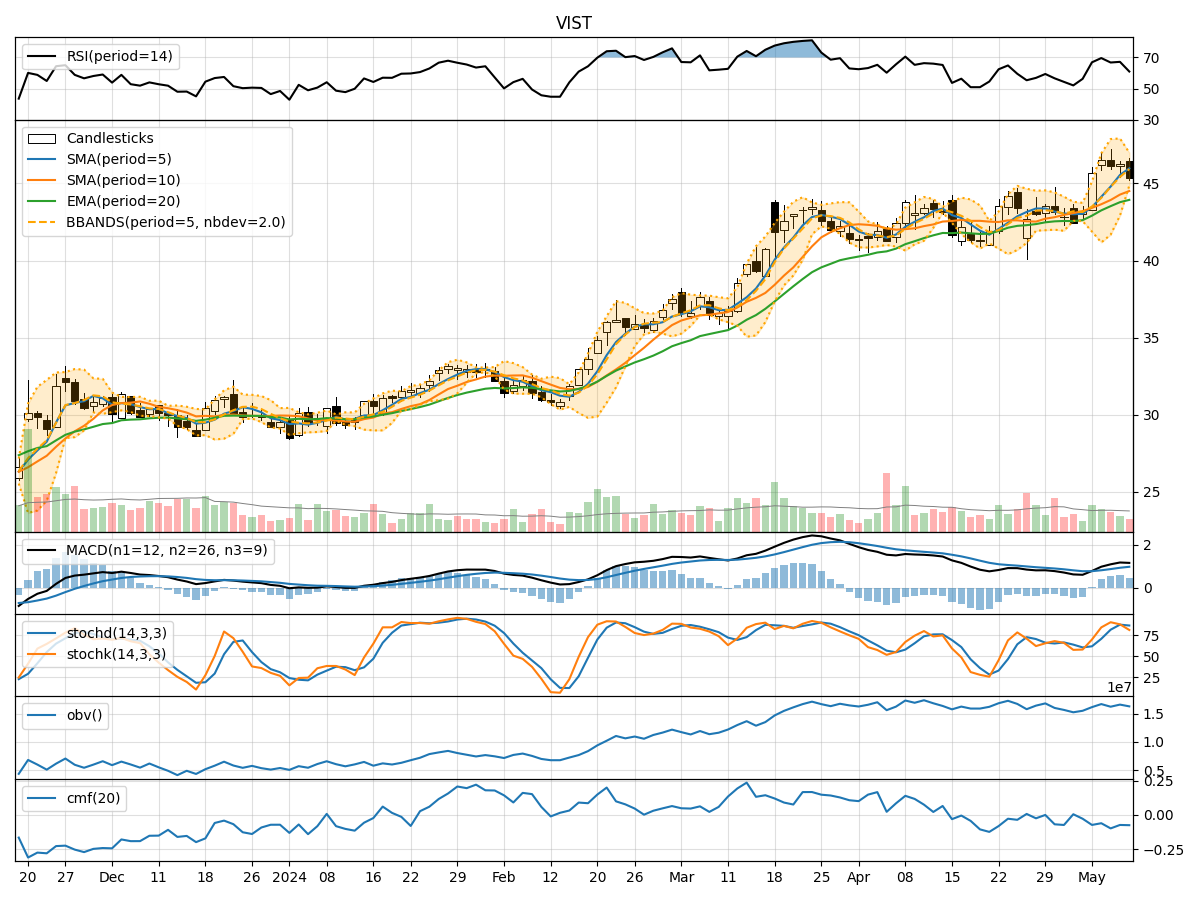
- Moving Averages (MA): The 5-day MA has been consistently above the closing prices, indicating a bullish trend.
- MACD: The MACD line has been above the signal line, suggesting a bullish momentum.
- EMA: The EMA has been trending upwards, supporting the bullish sentiment.
Momentum Indicators:
- RSI: The RSI has been in the overbought territory, indicating a strong bullish momentum.
- Stochastic Oscillator: Both %K and %D have been in the overbought zone, signaling a strong bullish momentum.
- Williams %R: The indicator has been in the oversold region, suggesting a potential reversal.
Volatility Indicators:
- Bollinger Bands (BB): The stock price has been trading within the bands, indicating a stable price movement.
- BB Percentage (BBP): The BBP has been fluctuating around the midline, suggesting a neutral stance on volatility.
Volume Indicators:
- On-Balance Volume (OBV): The OBV has been fluctuating, indicating mixed buying and selling pressure.
- Chaikin Money Flow (CMF): The CMF has been negative, suggesting a bearish sentiment in terms of money flow.
Key Observations:
- The trend indicators point towards a bullish sentiment, supported by moving averages and MACD.
- Momentum indicators reflect a strong bullish momentum, as indicated by RSI and Stochastic Oscillator.
- Volatility remains relatively stable, with the stock price trading within the Bollinger Bands.
- Volume indicators show mixed signals, with OBV fluctuating and CMF indicating a bearish money flow sentiment.
Conclusion:
Based on the analysis of the technical indicators, the next few days' possible stock price movement for VIST is likely to be upward. The bullish trend and momentum indicators suggest a continuation of the positive price action. However, it is essential to monitor the volume indicators closely for any shifts in buying or selling pressure. Overall, the outlook for VIST appears bullish in the short term.