Technical Analysis of VNT 2024-05-10
Overview:
In analyzing the technical indicators for VNT over the last 5 days, we will delve into the trend, momentum, volatility, and volume indicators to provide a comprehensive outlook on the possible stock price movement in the coming days.
Trend Analysis:
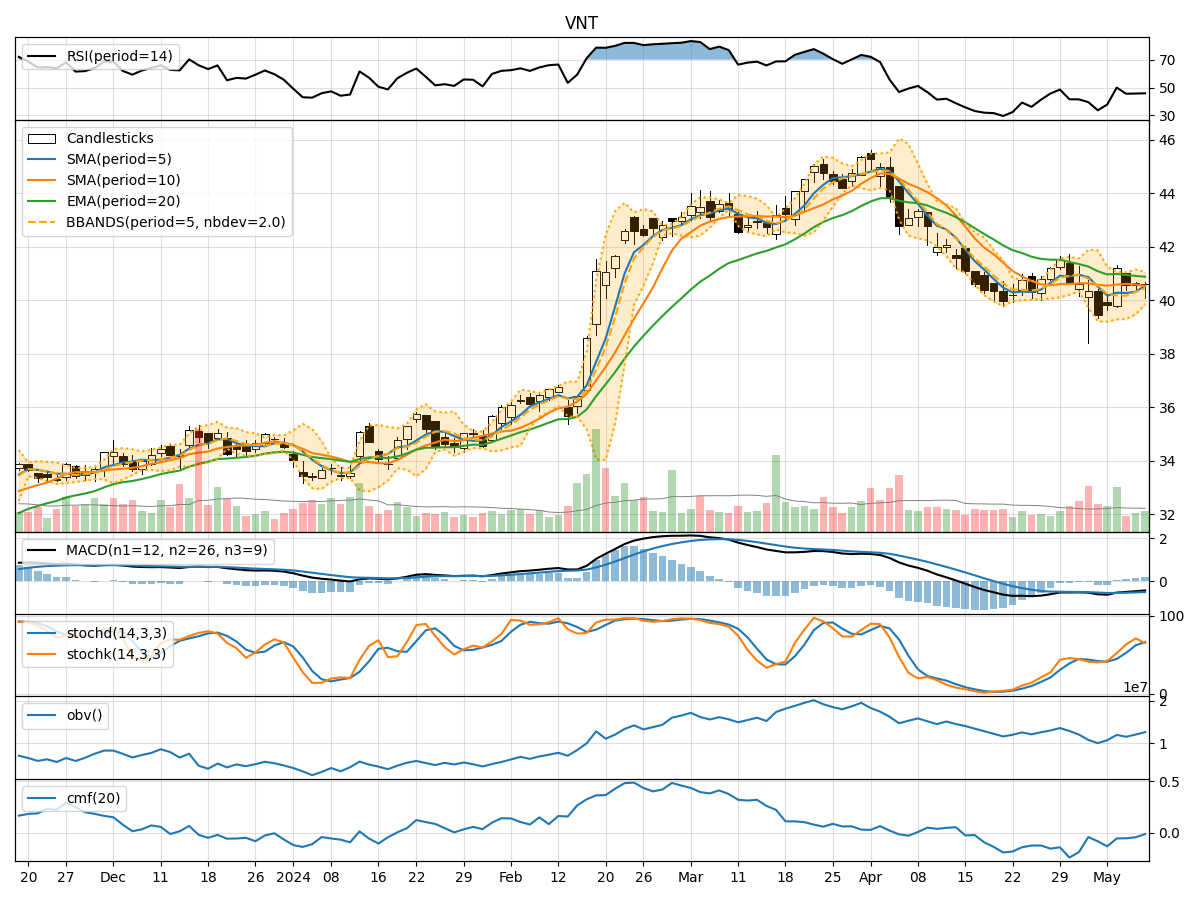
- Moving Averages (MA): The 5-day Moving Average (MA) has been fluctuating around the closing prices, indicating short-term price trends. The Simple Moving Average (SMA) and Exponential Moving Average (EMA) have been relatively close, suggesting stability in the trend.
- MACD: The Moving Average Convergence Divergence (MACD) has shown a negative trend, with the MACD line consistently below the signal line. This indicates a bearish momentum in the stock price.
- Conclusion: The trend indicators suggest a bearish outlook for VNT in the short term.
Momentum Analysis:
- RSI: The Relative Strength Index (RSI) has been hovering around the mid-range, indicating a balanced momentum between buying and selling pressure.
- Stochastic Oscillator: Both %K and %D have shown fluctuations but have been mostly in the overbought territory, suggesting a potential reversal in price direction.
- Conclusion: The momentum indicators imply a neutral stance for VNT, with a slight inclination towards a bearish bias.
Volatility Analysis:
- Bollinger Bands (BB): The Bollinger Bands have shown narrowing bands, indicating decreasing volatility in the stock price. The %B value has been relatively low, suggesting a potential price breakout.
- Conclusion: Volatility indicators point towards a consolidation phase for VNT, with a potential for a breakout in either direction.
Volume Analysis:
- On-Balance Volume (OBV): The OBV has shown mixed movements, indicating indecision among investors regarding the stock.
- Chaikin Money Flow (CMF): The CMF has been negative, reflecting selling pressure in the stock.
- Conclusion: Volume indicators signal a neutral to bearish sentiment among investors towards VNT.
Overall Conclusion:
Based on the analysis of trend, momentum, volatility, and volume indicators, the overall outlook for VNT in the next few days leans towards a bearish sentiment. The trend indicators suggest a bearish trend, while momentum indicators show a neutral to slightly bearish momentum. Volatility indicators point towards a consolidation phase with a potential breakout, and volume indicators reflect a neutral to bearish sentiment among investors.
Recommendation:
Considering the comprehensive analysis of technical indicators, it is advisable to exercise caution when trading VNT in the coming days. Investors may consider implementing risk management strategies and closely monitoring key support and resistance levels for potential entry or exit points. A prudent approach would be to wait for further confirmation of a clear trend direction before making significant trading decisions.