Technical Analysis of VOYA 2024-05-10
Overview:
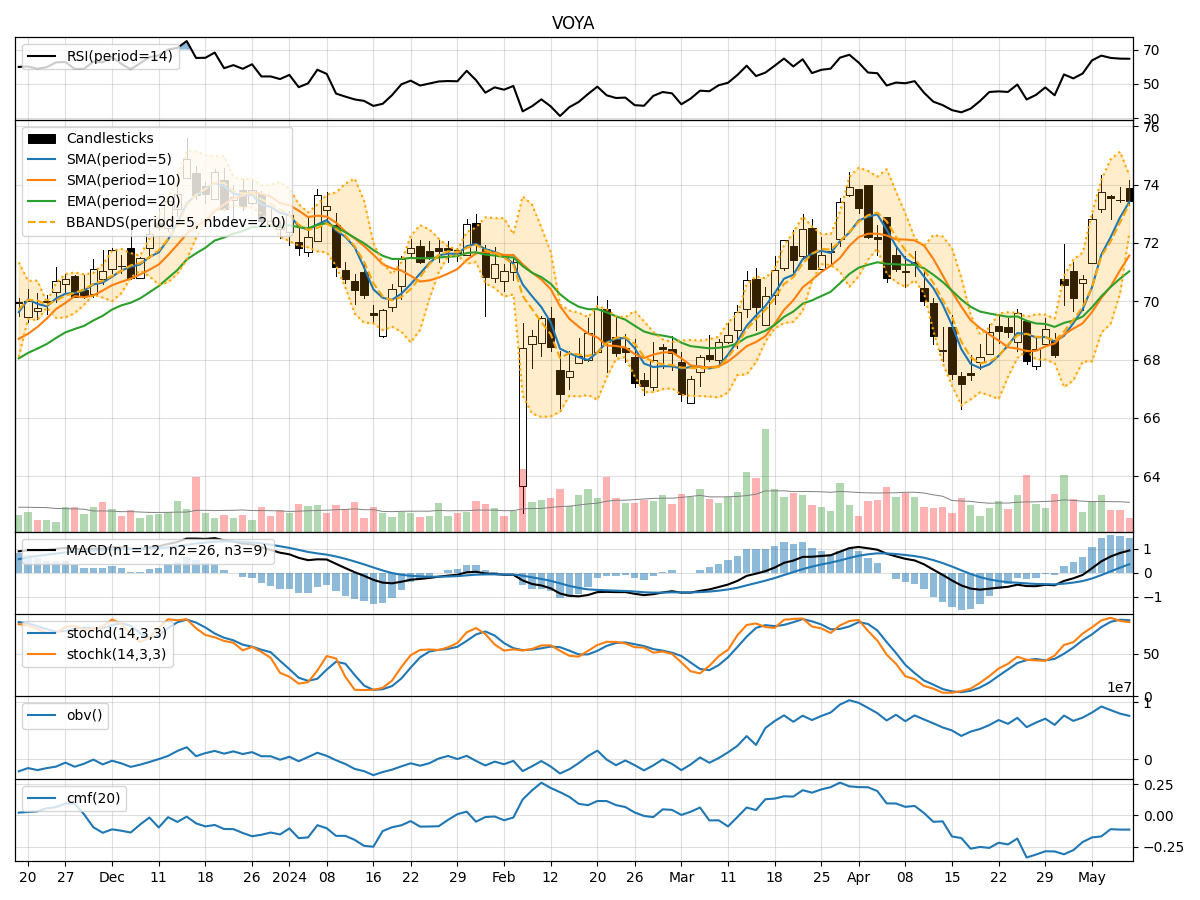
In analyzing the technical indicators for VOYA over the last 5 days, we will delve into the trend, momentum, volatility, and volume indicators to provide a comprehensive assessment of the stock's potential price movement. By examining these key factors, we aim to offer valuable insights and predictions for the next few days.
Trend Indicators:
- Moving Averages (MA): The 5-day moving average has been consistently rising, indicating a bullish trend in the short term.
- MACD (Moving Average Convergence Divergence): The MACD line has been above the signal line, suggesting bullish momentum.
- EMA (Exponential Moving Average): The EMA has been trending upwards, supporting the bullish sentiment.
Key Observation: The trend indicators point towards a bullish outlook for VOYA in the short term.
Momentum Indicators:
- RSI (Relative Strength Index): The RSI has been in the overbought territory, signaling strong buying momentum.
- Stochastic Oscillator: Both %K and %D have been in the overbought zone, indicating a potential reversal.
- Williams %R (Willams Percentage Range): The indicator has been in the oversold region, suggesting a possible buying opportunity.
Key Observation: Momentum indicators show conflicting signals with RSI indicating overbought conditions while Stochastic and Williams %R hint at a potential reversal.
Volatility Indicators:
- Bollinger Bands: The stock price has been trading within the upper Bollinger Band, indicating an overbought condition.
- Bollinger Band Width: The band width has been narrowing, suggesting a decrease in volatility.
- Bollinger Band %B: The %B indicator has been above 0.8, indicating an overbought condition.
Key Observation: Volatility indicators suggest a potential decrease in volatility and a possible reversal in the stock price.
Volume Indicators:
- On-Balance Volume (OBV): The OBV has been declining, indicating selling pressure in the stock.
- Chaikin Money Flow (CMF): The CMF has been negative, suggesting a bearish money flow trend.
Key Observation: Volume indicators point towards a bearish sentiment with selling pressure dominating.
Conclusion:
Based on the analysis of the technical indicators, the next few days for VOYA are likely to see a downward movement. The trend indicators support a bullish outlook, but conflicting signals from momentum indicators and bearish indications from volume and volatility indicators suggest a potential reversal in the stock price. Traders should exercise caution and consider potential short-term bearish opportunities in their trading strategies.