Technical Analysis of VSTO 2024-05-10
Overview:
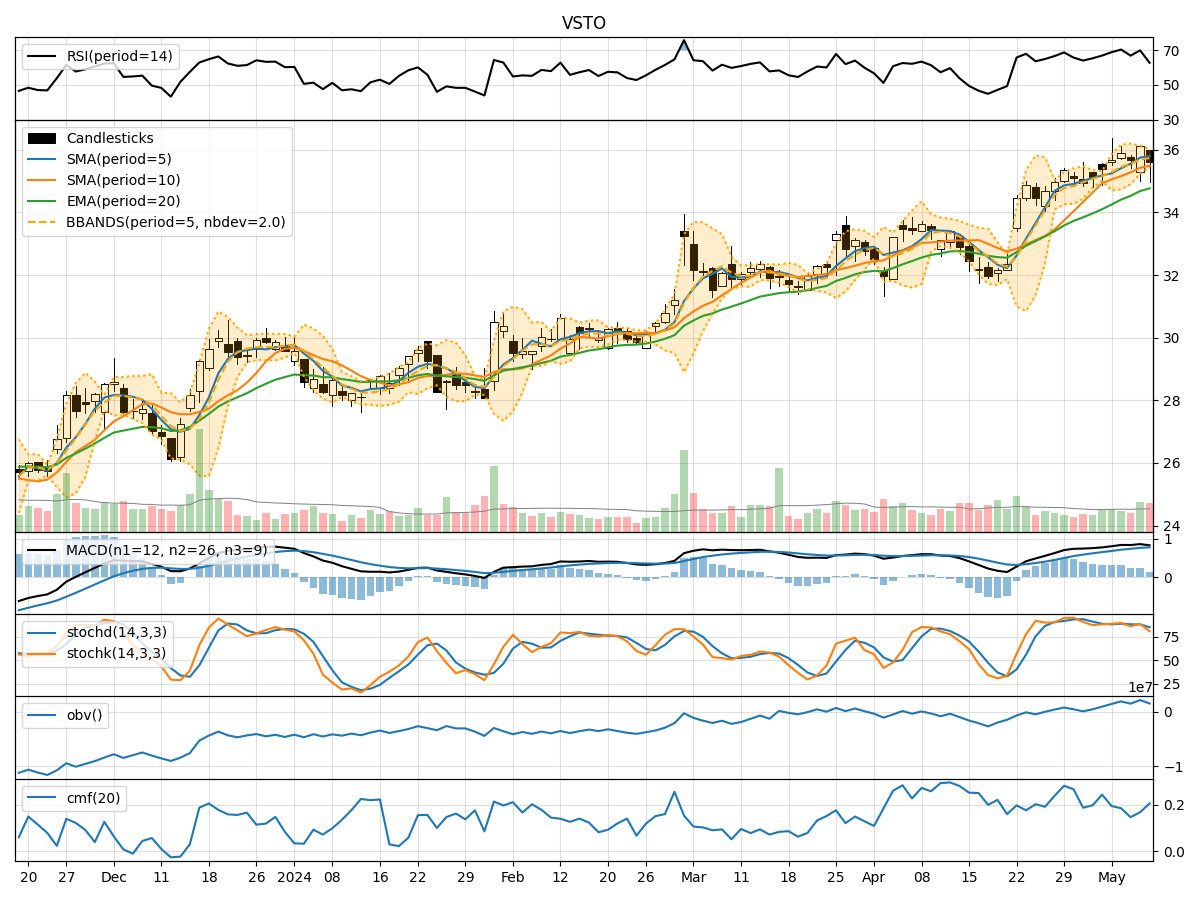
In analyzing the technical indicators for VSTO over the last 5 days, we will delve into the trend, momentum, volatility, and volume indicators to provide a comprehensive outlook on the possible stock price movement. By examining these key aspects, we aim to offer valuable insights and predictions for the upcoming days.
Trend Indicators:
- Moving Averages (MA): The 5-day MA has been consistently above the closing prices, indicating a short-term uptrend.
- MACD: The MACD line has been positive and increasing, suggesting bullish momentum.
- RSI: The RSI values have been relatively high, indicating potential overbought conditions.
Key Observation: The trend indicators suggest a bullish sentiment in the short term.
Momentum Indicators:
- Stochastic Oscillator: Both %K and %D have been in the overbought zone, signaling potential for a reversal.
- Williams %R: The indicator has been in the oversold territory, indicating a possible buying opportunity.
Key Observation: Momentum indicators show conflicting signals, with stochastic suggesting a potential reversal and Williams %R signaling a buying opportunity.
Volatility Indicators:
- Bollinger Bands (BB): The stock price has mostly stayed within the bands, indicating moderate volatility.
- BB %B: The %B values have been fluctuating around the midline, suggesting a balanced market sentiment.
Key Observation: Volatility indicators point towards a stable market with no extreme price movements.
Volume Indicators:
- On-Balance Volume (OBV): The OBV has shown mixed movements, indicating indecision among investors.
- Chaikin Money Flow (CMF): The CMF values have been positive, suggesting buying pressure.
Key Observation: Volume indicators reflect a lack of clear direction in investor sentiment.
Conclusion:
Based on the analysis of the technical indicators, the next few days for VSTO could see sideways consolidation with a slight bias towards bullish sentiment. The trend indicators support a short-term uptrend, while momentum indicators show conflicting signals that may lead to a period of consolidation. Volatility remains moderate, indicating stable price movements, and volume indicators suggest a lack of strong conviction among investors.
Overall View: The stock is likely to experience sideways consolidation with a slight bullish bias in the upcoming days. Traders should monitor key support and resistance levels for potential breakout opportunities.
Remember, market conditions can change rapidly, so it's essential to stay updated with real-time data and adjust your trading strategy accordingly.