Technical Analysis of VSTS 2024-05-10
Overview:
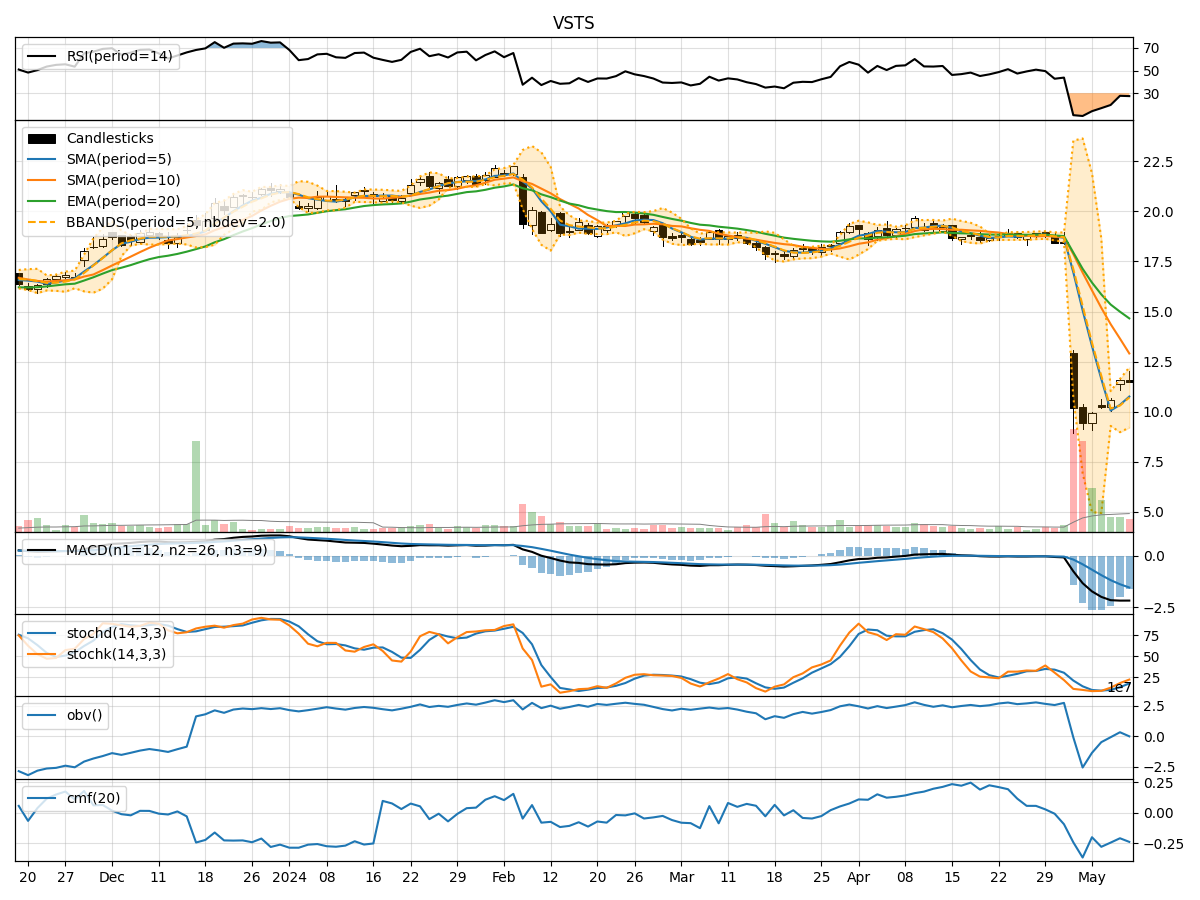
In analyzing the technical indicators for VSTS over the last 5 days, we will delve into the trend, momentum, volatility, and volume indicators to provide a comprehensive outlook on the possible stock price movement in the coming days. By examining these key indicators, we aim to offer valuable insights and predictions for informed decision-making.
Trend Analysis:
- Moving Averages (MA): The 5-day MA has been consistently below the closing prices, indicating a downward trend.
- MACD: The MACD line has been consistently below the signal line, suggesting a bearish trend.
- EMA: The EMA has been declining, further confirming the bearish sentiment in the short to medium term.
Momentum Analysis:
- RSI: The RSI has been increasing, indicating a potential reversal towards oversold conditions.
- Stochastic Oscillator: Both %K and %D have been rising, signaling increasing buying momentum.
- Williams %R: The indicator has been moving towards oversold territory, suggesting a possible buying opportunity.
Volatility Analysis:
- Bollinger Bands (BB): The bands have been narrowing, indicating decreasing volatility.
- BB %B: The %B has been declining, suggesting a potential consolidation phase.
- BB Width: The narrowing of the bands suggests a period of reduced price fluctuations.
Volume Analysis:
- On-Balance Volume (OBV): The OBV has been declining, indicating selling pressure.
- Chaikin Money Flow (CMF): The CMF has been negative, reflecting a lack of buying interest.
Conclusion:
Based on the analysis of the technical indicators, the stock of VSTS is currently in a bearish phase with downward trends in moving averages, MACD, and EMA. However, there are signs of potential reversal in momentum indicators such as RSI and Stochastic Oscillator, indicating a possible short-term buying opportunity. The volatility is decreasing, suggesting a period of consolidation, while volume indicators show selling pressure.
Forecast:
In the next few days, we may see a short-term bullish movement as momentum indicators hint at a potential reversal. However, the overall trend remains bearish, so caution is advised. Traders may consider taking advantage of short-term buying opportunities while being mindful of the broader bearish sentiment in the market.