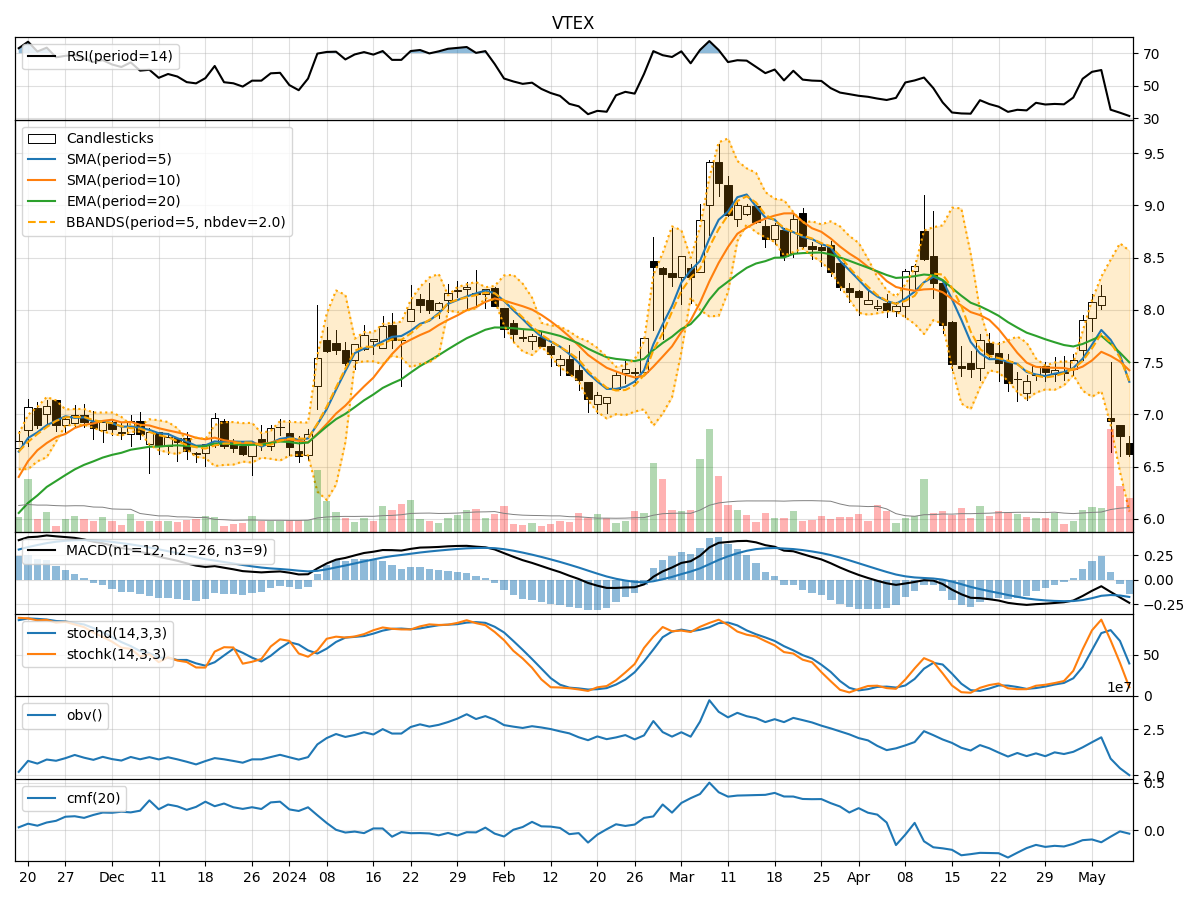
Technical Analysis of VTEX 2024-05-10
Overview:
In analyzing the technical indicators for VTEX over the last 5 days, we will delve into the trend, momentum, volatility, and volume indicators to provide a comprehensive assessment of the stock's potential price movement. By examining these key factors, we aim to offer valuable insights and predictions for the next few days.
Trend Analysis:
- Moving Averages (MA): The 5-day Moving Average (MA) has been fluctuating around the Simple Moving Average (SMA) and Exponential Moving Average (EMA) values, indicating a lack of clear trend direction.
- MACD: The Moving Average Convergence Divergence (MACD) has been negative, with the MACD line consistently below the signal line, suggesting a bearish trend.
- RSI: The Relative Strength Index (RSI) has been hovering around the mid-range, indicating a neutral sentiment in terms of momentum.
Momentum Analysis:
- Stochastic Oscillator: The Stochastic Oscillator has been in oversold territory, suggesting a potential reversal or bounce in the stock price.
- Williams %R: The Williams %R indicator has been deeply in oversold territory, indicating a possible buying opportunity.
Volatility Analysis:
- Bollinger Bands: The Bollinger Bands have been narrowing, indicating decreasing volatility in the stock price.
- Volatility Bands: The Volatility Bands have been contracting, suggesting a potential breakout or significant price movement in the near future.
Volume Analysis:
- On-Balance Volume (OBV): The OBV has been declining, indicating selling pressure in the stock.
- Chaikin Money Flow (CMF): The CMF has been negative, reflecting a lack of buying interest in the stock.
Key Observations:
- The stock is currently in a consolidation phase with mixed signals from the trend and momentum indicators.
- Volatility has been decreasing, potentially leading to a period of price stabilization.
- The volume indicators suggest a lack of strong buying interest in the stock.
Conclusion:
Based on the analysis of the technical indicators, the next few days for VTEX could see sideways movement with a slight bias towards a bearish outlook. Traders should exercise caution and wait for clearer signals before making significant trading decisions. It is advisable to monitor the Stochastic Oscillator and Williams %R for potential reversal signals, while keeping an eye on the OBV and CMF for any shifts in buying or selling pressure.