Technical Analysis of VVV 2024-05-10
Overview:
In analyzing the technical indicators for VVV stock over the last 5 days, we will delve into the trend, momentum, volatility, and volume indicators to provide a comprehensive outlook on the possible future stock price movement. By examining these key indicators, we aim to offer valuable insights and predictions for the upcoming trading days.
Trend Analysis:
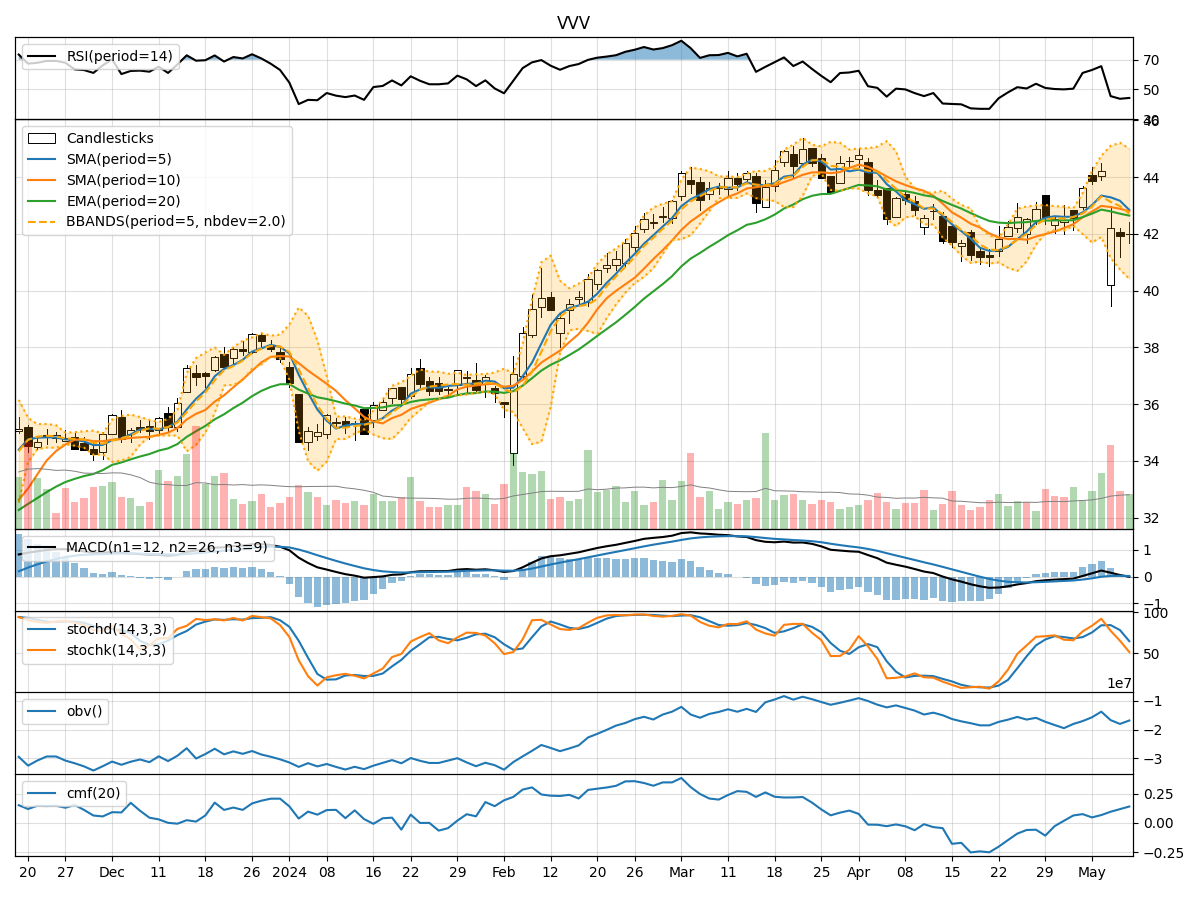
- Moving Averages (MA): The 5-day Moving Average (MA) has been fluctuating around the closing prices, indicating short-term price trends. The Simple Moving Average (SMA) and Exponential Moving Average (EMA) have shown a slight divergence, suggesting potential shifts in momentum.
- MACD: The Moving Average Convergence Divergence (MACD) has been positive but decreasing, with the MACD line approaching the signal line. This could signal a potential reversal or slowdown in the current trend.
Momentum Analysis:
- RSI: The Relative Strength Index (RSI) has been fluctuating in the neutral zone, indicating a lack of strong buying or selling pressure.
- Stochastic Oscillator: The Stochastic Oscillator has been trending downwards, suggesting a potential bearish momentum in the short term.
- Williams %R: The Williams %R indicator has been in the oversold territory, indicating a possible reversal or bounce-back in prices.
Volatility Analysis:
- Bollinger Bands: The Bollinger Bands have been narrowing, indicating decreasing volatility and a potential period of consolidation.
- Bollinger %B: The Bollinger %B indicator has been hovering around the midline, suggesting a balanced market sentiment with no extreme overbought or oversold conditions.
Volume Analysis:
- On-Balance Volume (OBV): The OBV indicator has shown mixed signals, with volume not strongly confirming the price movements.
- Chaikin Money Flow (CMF): The CMF has been gradually increasing, indicating a potential inflow of money into the stock.
Conclusion:
Based on the analysis of the technical indicators, the stock of VVV is likely to experience sideways movement in the next few days. The trend indicators suggest a potential consolidation phase, supported by decreasing volatility and mixed volume signals. The momentum indicators point towards a lack of strong directional bias, while the volume indicators do not provide a clear confirmation of the price movements.
In conclusion, it is recommended to exercise caution and closely monitor the price action for any potential breakout or trend reversal. Traders may consider adopting a wait-and-see approach until clearer signals emerge in the technical indicators to make informed trading decisions.