Technical Analysis of VYX 2024-05-10
Overview:
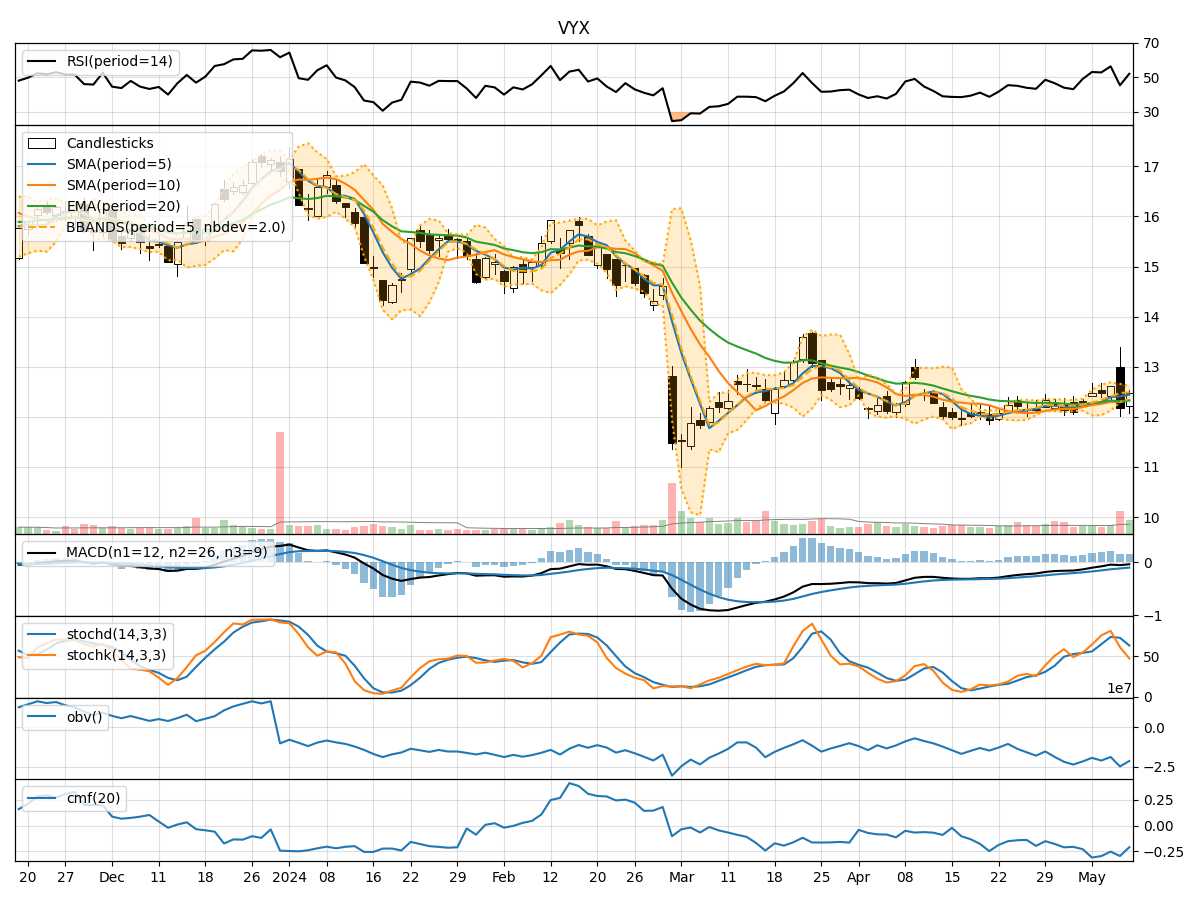
In analyzing the technical indicators for VYX over the last 5 days, we will delve into the trend, momentum, volatility, and volume indicators to provide a comprehensive outlook on the possible stock price movement in the coming days. By examining these key indicators, we aim to offer valuable insights and predictions for potential investors.
Trend Indicators:
- Moving Averages (MA): The 5-day moving average has been showing an upward trend, indicating a positive momentum in the stock price.
- MACD (Moving Average Convergence Divergence): The MACD line has been consistently above the signal line, suggesting a bullish trend.
- EMA (Exponential Moving Average): The EMA has been trending upwards, supporting the notion of a bullish sentiment in the stock.
Momentum Indicators:
- RSI (Relative Strength Index): The RSI has been fluctuating around the neutral zone, indicating a balanced momentum in the stock price.
- Stochastic Oscillator: The stochastic indicators have shown mixed signals, with some days indicating overbought conditions and others oversold.
Volatility Indicators:
- Bollinger Bands: The Bollinger Bands have been relatively narrow, suggesting low volatility in the stock price.
- BBP (Bollinger Band %B): The %B value has been hovering around the middle range, indicating a lack of extreme price movements.
Volume Indicators:
- On-Balance Volume (OBV): The OBV has shown mixed signals, with some days indicating selling pressure and others buying pressure.
- Chaikin Money Flow (CMF): The CMF has been negative, indicating a bearish sentiment in the stock.
Key Observations and Opinions:
- Trend: The trend indicators suggest a bullish sentiment in the stock, supported by the moving averages and MACD.
- Momentum: The momentum indicators show a mixed picture, with the RSI indicating a neutral stance and stochastic oscillators providing conflicting signals.
- Volatility: The volatility indicators point towards low volatility in the stock price, as indicated by the narrow Bollinger Bands.
- Volume: The volume indicators suggest a lack of strong buying or selling pressure, with the OBV and CMF showing mixed signals.
Conclusion:
Based on the analysis of the technical indicators, the stock of VYX is likely to experience sideways movement in the coming days. The bullish trend indicated by the moving averages and MACD may be offset by the mixed signals from the momentum and volume indicators. The low volatility in the stock price further supports the view of a consolidation phase. Investors are advised to closely monitor the price action and wait for clearer signals before making any significant trading decisions.