Technical Analysis of WAB 2024-05-10
Overview:
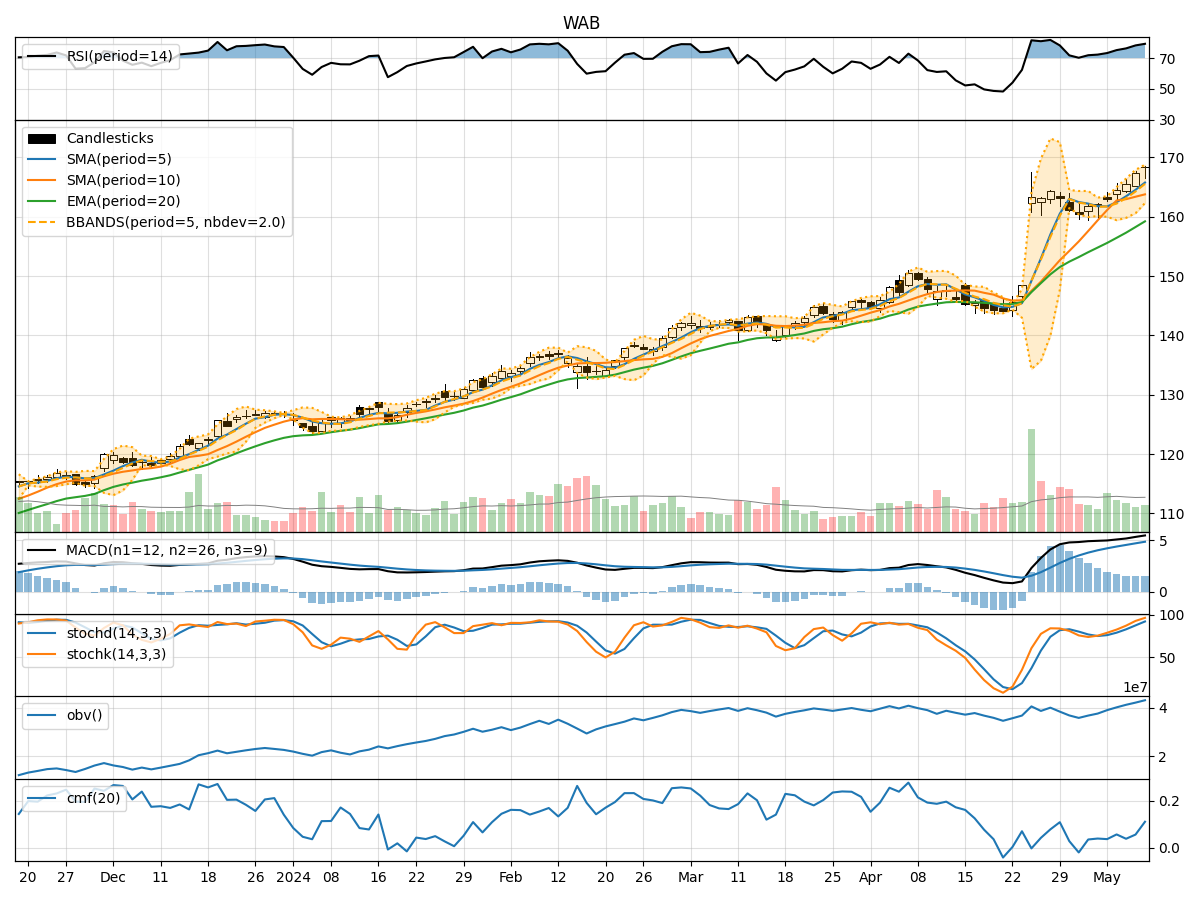
In the last 5 trading days, WAB stock has shown a consistent uptrend in both price and volume. The moving averages (MA) have been steadily increasing, indicating a bullish trend. Momentum indicators like RSI and Stochastic Oscillator are in overbought territory, suggesting a strong buying momentum. Volatility indicators show an expanding Bollinger Bands width, indicating increased price volatility. Volume indicators like On-Balance Volume (OBV) and Chaikin Money Flow (CMF) have been rising, confirming the bullish sentiment.
Trend Analysis:
- Moving Averages (MA): The 5-day MA has been consistently above the 10-day Simple Moving Average (SMA), indicating a short-term bullish trend. The Exponential Moving Average (EMA) has also been rising, supporting the bullish momentum.
- MACD: The MACD line has been above the signal line for the past 5 days, indicating a bullish trend. The MACD Histogram has been positive, suggesting increasing bullish momentum.
Momentum Analysis:
- RSI: The Relative Strength Index (RSI) has been in overbought territory above 70 for the last few days, indicating a strong buying momentum. However, it may also suggest an overextended rally.
- Stochastic Oscillator: Both %K and %D lines of the Stochastic Oscillator are in the overbought zone, signaling a potential reversal or consolidation.
Volatility Analysis:
- Bollinger Bands (BB): The Bollinger Bands width has been expanding, indicating increasing price volatility. This could lead to larger price swings in the near future.
Volume Analysis:
- On-Balance Volume (OBV): The OBV has been steadily increasing, showing that volume has been higher on up days compared to down days. This confirms the bullish trend.
- Chaikin Money Flow (CMF): The CMF has been positive and rising, indicating strong buying pressure in the stock.
Conclusion:
Based on the technical indicators and analysis: - Trend: The stock is in a strong upward trend supported by moving averages and MACD. - Momentum: The momentum indicators suggest a strong buying momentum, but the overbought conditions may lead to a potential reversal or consolidation. - Volatility: Increasing Bollinger Bands width indicates higher volatility and the potential for larger price movements. - Volume: Rising OBV and CMF confirm the bullish sentiment in the stock.
Overall Opinion:
Given the current technical indicators, the next few days for WAB stock are likely to see continued upward movement with the potential for increased volatility and a possible consolidation or reversal due to overbought conditions. Traders should closely monitor key support and resistance levels along with any signs of a trend reversal.