Technical Analysis of WBX 2024-05-10
Overview:
In analyzing the technical indicators for WBX stock over the last 5 days, we will delve into the trends, momentum, volatility, and volume indicators to provide a comprehensive outlook on the possible future stock price movement. By examining these key indicators, we aim to offer valuable insights and predictions for the upcoming trading days.
Trend Analysis:
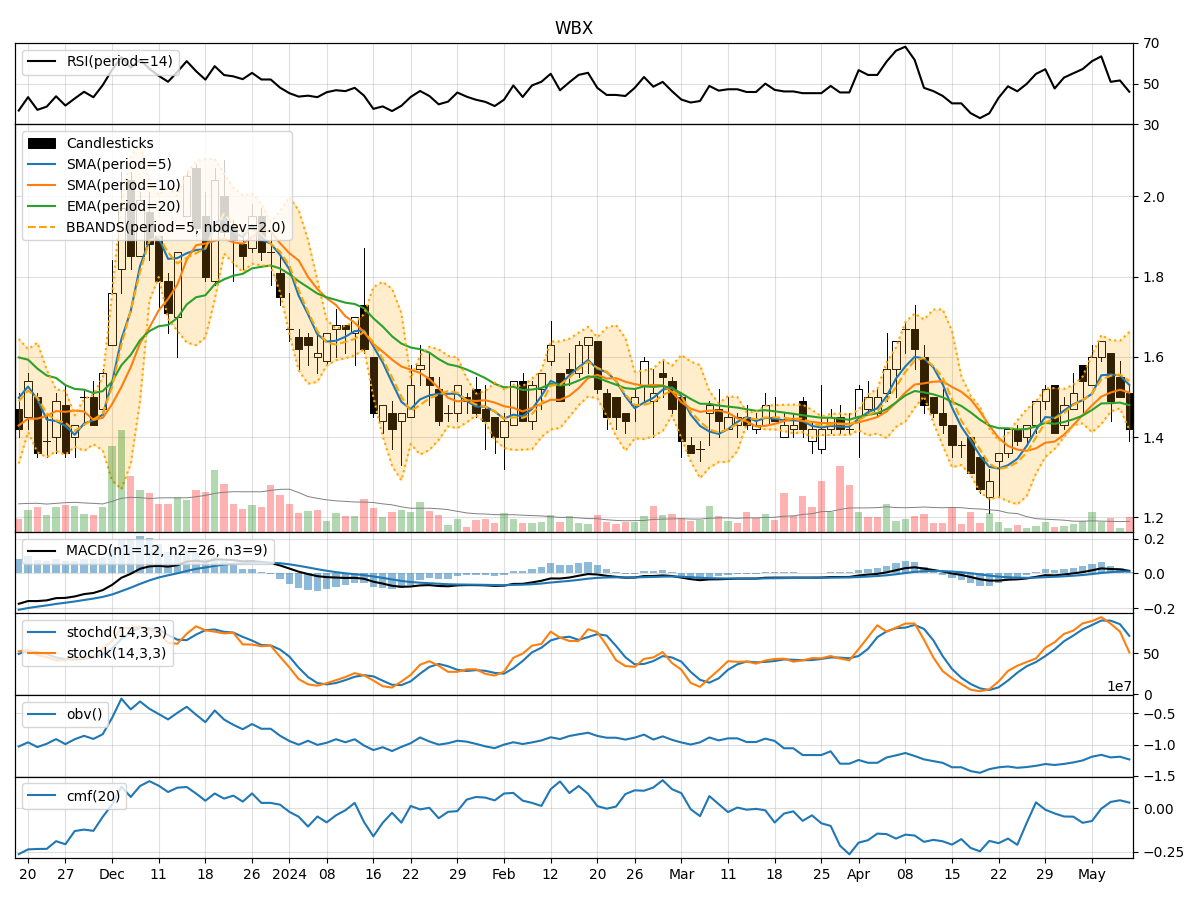
- Moving Averages (MA): The 5-day Moving Average (MA) has been fluctuating around the closing prices, indicating short-term price trends. The Simple Moving Average (SMA) and Exponential Moving Average (EMA) show a slight upward trend, suggesting potential bullish momentum.
- MACD: The Moving Average Convergence Divergence (MACD) has been positive, with the MACD line consistently above the signal line. This signals a bullish trend in the stock price.
- Conclusion: The trend indicators suggest a bullish outlook for WBX stock in the near term.
Momentum Analysis:
- RSI: The Relative Strength Index (RSI) has been hovering around the neutral zone, indicating a balanced momentum between buying and selling pressure.
- Stochastic Oscillator: The Stochastic Oscillator shows mixed signals, with the %K and %D lines fluctuating. This suggests indecision in the market sentiment.
- Conclusion: The momentum indicators reflect a neutral stance, with no clear direction for WBX stock.
Volatility Analysis:
- Bollinger Bands (BB): The Bollinger Bands have shown narrowing bands, indicating decreasing volatility. The %B value has been relatively stable, suggesting a lack of significant price fluctuations.
- Conclusion: The volatility indicators point towards a sideways movement or consolidation phase for WBX stock.
Volume Analysis:
- On-Balance Volume (OBV): The OBV has been fluctuating, indicating mixed buying and selling pressure. The Chaikin Money Flow (CMF) has shown a slight positive trend, suggesting some accumulation.
- Conclusion: The volume indicators suggest a mixed sentiment among market participants.
Overall Conclusion:
Based on the analysis of trend, momentum, volatility, and volume indicators, the bullish trend indicated by the moving averages and MACD is likely to drive the stock price higher in the near future. However, the neutral momentum and mixed volume signals may lead to some consolidation or sideways movement in the short term. The sideways volatility indicated by the Bollinger Bands further supports this view.
Recommendation:
Considering the overall analysis, it is advisable to monitor the stock closely for any breakout or reversal signals. Traders may consider buying on dips within the context of the overall bullish trend, while investors should exercise caution and wait for more definitive signals before making significant moves. It is essential to set stop-loss levels to manage risk effectively in this uncertain market environment.
In conclusion, while the technical indicators point towards a potential upward movement in WBX stock, it is crucial to remain vigilant and adapt to changing market conditions. Conducting further analysis and staying informed about market developments will be key to making informed trading decisions.