Technical Analysis of WDH 2024-05-10
Overview:
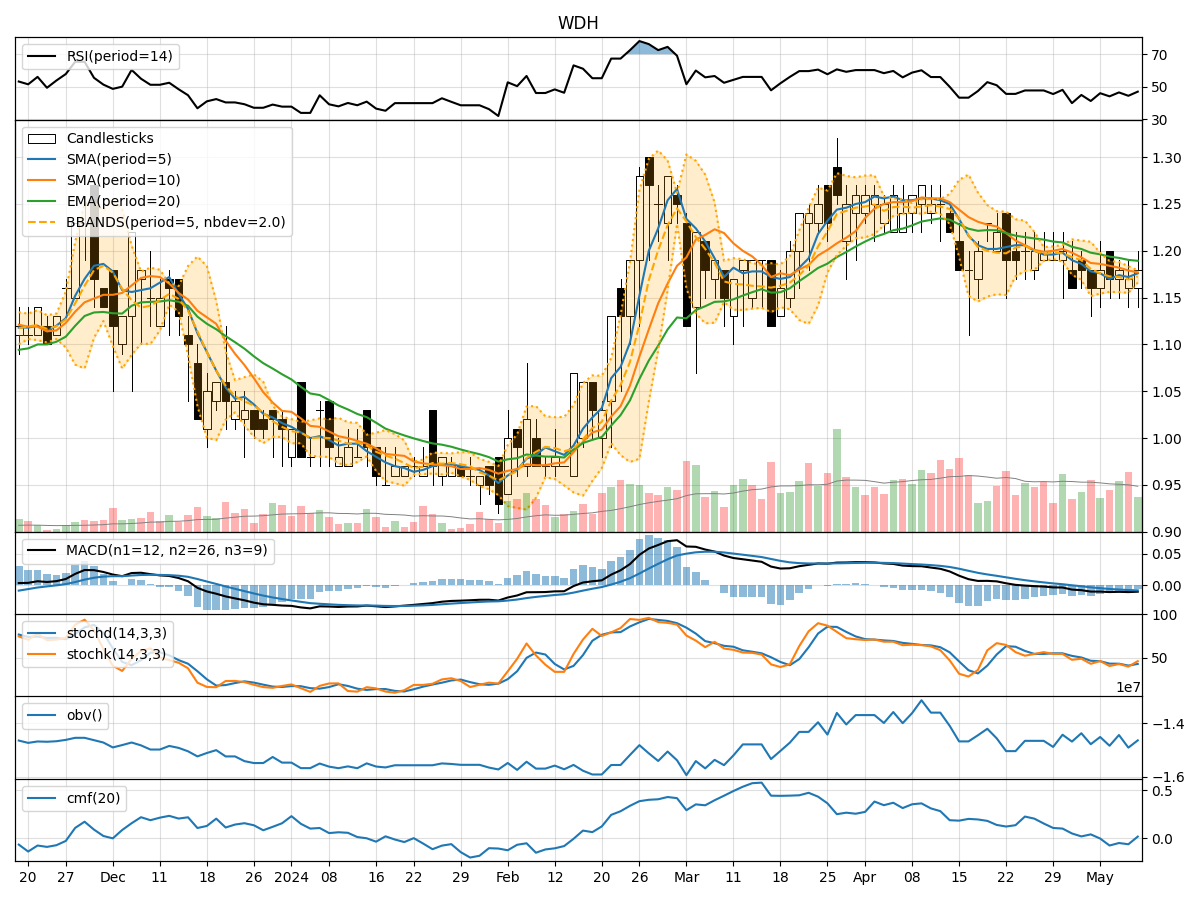
In analyzing the technical indicators for WDH over the last 5 days, we will delve into the trend, momentum, volatility, and volume indicators to provide a comprehensive outlook on the possible stock price movement in the coming days.
Trend Indicators:
- Moving Averages (MA): The 5-day MA has been fluctuating around the current price, indicating a lack of clear trend direction.
- MACD: The MACD line has been consistently below the signal line, suggesting a bearish momentum in the short term.
- EMA: The EMA has been gradually declining, indicating a bearish sentiment in the market.
Momentum Indicators:
- RSI: The RSI has been hovering around the 50 level, indicating a neutral stance in terms of momentum.
- Stochastic Oscillator: Both %K and %D have been fluctuating, not providing a clear signal on momentum direction.
- Williams %R: The indicator has been in oversold territory, suggesting a potential reversal in the short term.
Volatility Indicators:
- Bollinger Bands: The bands have been narrowing, indicating decreasing volatility in the stock price.
- Bollinger %B: The %B has been fluctuating around the midline, suggesting a lack of clear trend direction.
Volume Indicators:
- On-Balance Volume (OBV): The OBV has been fluctuating, not providing a clear indication of buying or selling pressure.
- Chaikin Money Flow (CMF): The CMF has been negative, indicating a bearish sentiment in terms of volume flow.
Key Observations and Opinions:
- Trend: The trend indicators suggest a bearish sentiment in the short term, with the MACD and EMA pointing towards potential downward movement.
- Momentum: The momentum indicators are mixed, with RSI neutral, Stochastic Oscillator fluctuating, and Williams %R indicating a possible reversal.
- Volatility: Volatility has been decreasing, indicating a period of consolidation or sideways movement.
- Volume: Volume indicators show a lack of clear buying or selling pressure, with a slightly bearish sentiment based on CMF.
Conclusion:
Based on the analysis of the technical indicators, the overall outlook for WDH in the next few days leans towards a sideways movement with a slight bearish bias. Traders should exercise caution and closely monitor key levels for potential reversals or breakout opportunities.