Technical Analysis of WEC 2024-05-10
Overview:
In analyzing the technical indicators for WEC over the last 5 days, we will delve into the trend, momentum, volatility, and volume indicators to provide a comprehensive outlook on the possible stock price movement in the coming days. By examining these key indicators, we aim to offer valuable insights and predictions for informed decision-making.
Trend Indicators:
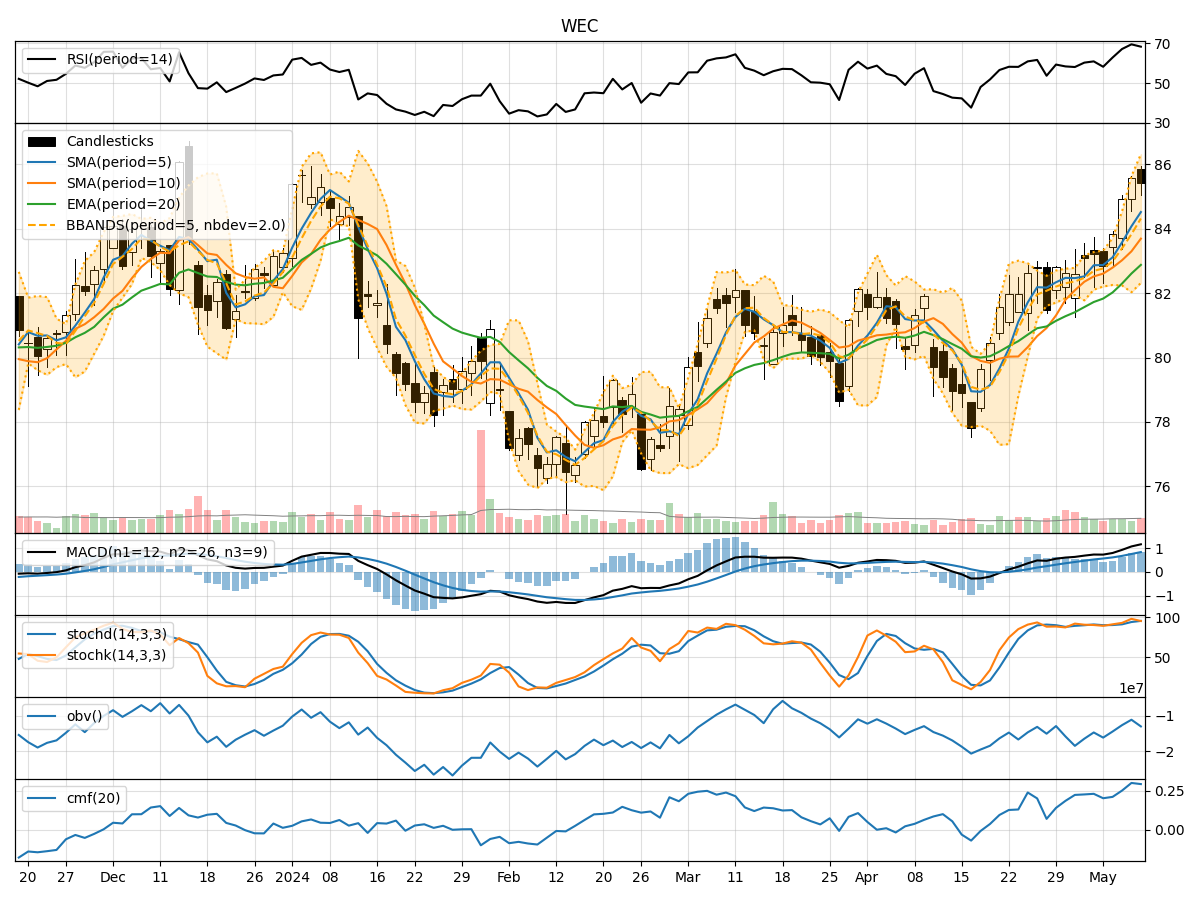
- Moving Averages (MA): The 5-day MA has been consistently above the closing prices, indicating a bullish trend.
- MACD: The MACD line has been above the signal line, with both showing an upward trend, suggesting bullish momentum.
- EMA: The EMA has been steadily increasing, supporting the bullish sentiment in the short to medium term.
Key Observation: The trend indicators point towards a strong bullish trend in the stock price.
Momentum Indicators:
- RSI: The RSI has been in the overbought territory, indicating strong buying momentum.
- Stochastic Oscillator: Both %K and %D have been in the overbought zone, suggesting a potential reversal.
- Williams %R: The indicator has been in the oversold region, signaling a possible upward movement.
Key Observation: Momentum indicators show a mixed signal with potential for a short-term correction.
Volatility Indicators:
- Bollinger Bands (BB): The stock price has been trading near the upper band, indicating high volatility.
- BB Width: The width of the bands has been expanding, suggesting increased price fluctuations.
- BB %B: The %B indicator has been above 0.8, indicating an overbought condition.
Key Observation: Volatility indicators suggest increased volatility in the stock price.
Volume Indicators:
- On-Balance Volume (OBV): The OBV has been increasing, reflecting strong buying pressure.
- Chaikin Money Flow (CMF): The CMF has been positive, indicating money flow into the stock.
Key Observation: Volume indicators support the bullish sentiment in the stock.
Conclusion:
Based on the analysis of the technical indicators, the stock of WEC is currently in a strong bullish trend, supported by positive momentum and volume indicators. However, the overbought conditions in some momentum indicators and high volatility suggest a potential for a short-term correction or consolidation before a possible continuation of the uptrend.
Recommendation:
- Short Term: Expect a possible correction or consolidation in the stock price.
- Medium to Long Term: The overall trend remains bullish, so consider buying on dips for potential long-term gains.
In conclusion, while the stock may experience some near-term volatility, the overall outlook remains positive for WEC. It is essential to monitor the indicators closely for any signs of a trend reversal or continuation.