Technical Analysis of WELL 2024-05-10
Overview:
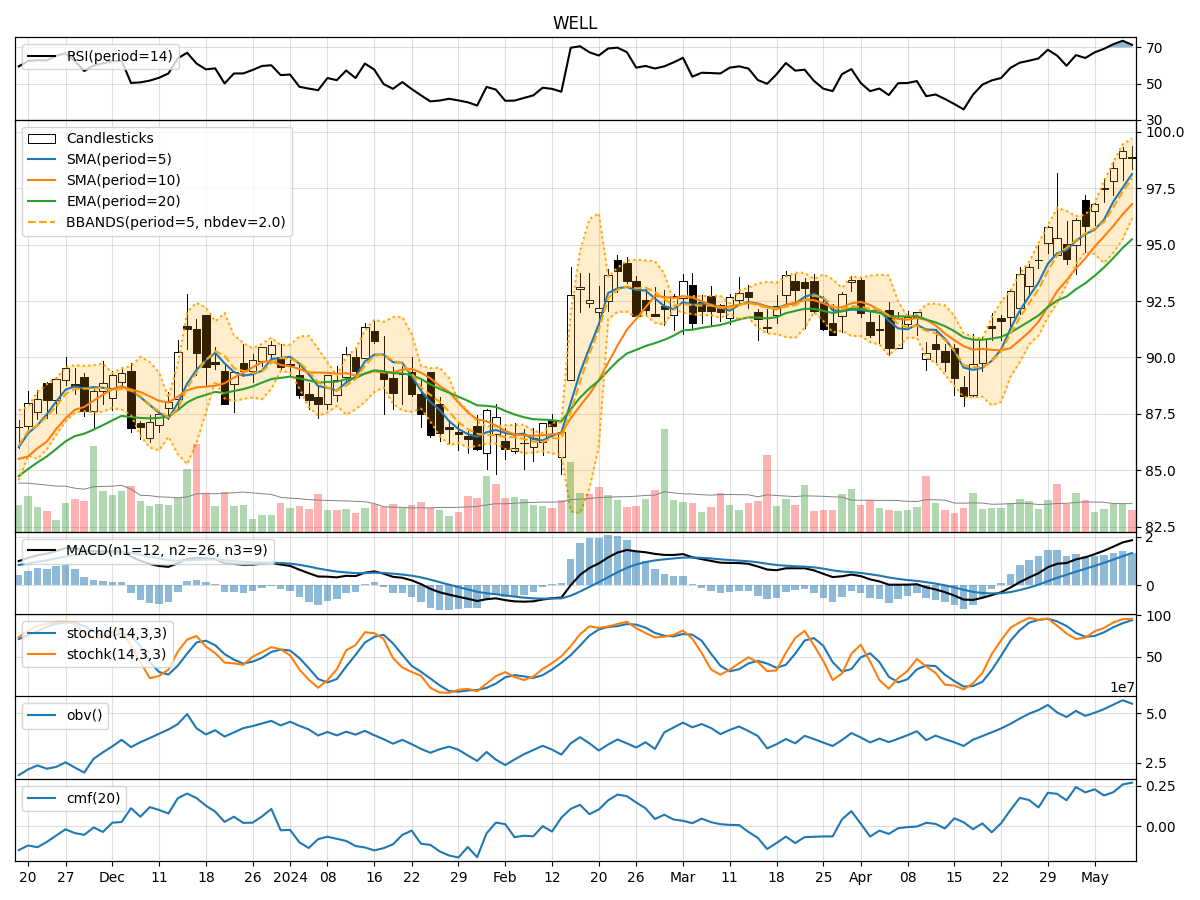
In the last 5 trading days, the stock price of WELL has shown a consistent uptrend, supported by increasing volume and positive momentum indicators. The volatility has also been relatively stable, indicating a controlled price movement.
Trend Analysis:
- Moving Averages (MA): The 5-day Moving Average (MA) has been consistently above the longer-term Simple Moving Average (SMA) and Exponential Moving Average (EMA), indicating a strong bullish trend.
- MACD: The MACD line has been consistently above the signal line, with both lines showing an upward trajectory, indicating bullish momentum.
- RSI: The Relative Strength Index (RSI) has been in the overbought territory, suggesting a strong bullish sentiment in the market.
Key Observation: The trend indicators suggest a strong bullish trend in the stock price of WELL.
Momentum Analysis:
- Stochastic Oscillator: Both %K and %D lines of the Stochastic Oscillator have been in the overbought zone, indicating strong buying pressure.
- Williams %R: The Williams %R indicator has been consistently below -20, signaling an overbought condition.
Key Observation: The momentum indicators confirm the bullish sentiment in the market, with strong buying pressure driving the stock price higher.
Volatility Analysis:
- Bollinger Bands: The Bollinger Bands have been relatively narrow, indicating stable price movement within a defined range.
- Bollinger %B: The %B indicator has been hovering around 1, suggesting that the stock price is trading at the upper band of the Bollinger Bands.
Key Observation: The volatility indicators suggest that the stock price of WELL is currently trading at the upper end of its price range with stable volatility.
Volume Analysis:
- On-Balance Volume (OBV): The OBV indicator has been consistently increasing, indicating strong buying volume in the stock.
- Chaikin Money Flow (CMF): The CMF indicator has been positive, reflecting a healthy inflow of money into the stock.
Key Observation: The volume indicators support the bullish trend, with increasing buying volume and positive money flow into the stock.
Conclusion:
Based on the comprehensive analysis of the technical indicators, it is evident that WELL is in a strong bullish trend with robust momentum, stable volatility, and increasing buying volume. The stock price is likely to continue its upward trajectory in the next few days. Traders and investors can consider buying opportunities in WELL, as the overall market sentiment remains positive.