Technical Analysis of WEX 2024-05-10
Overview:
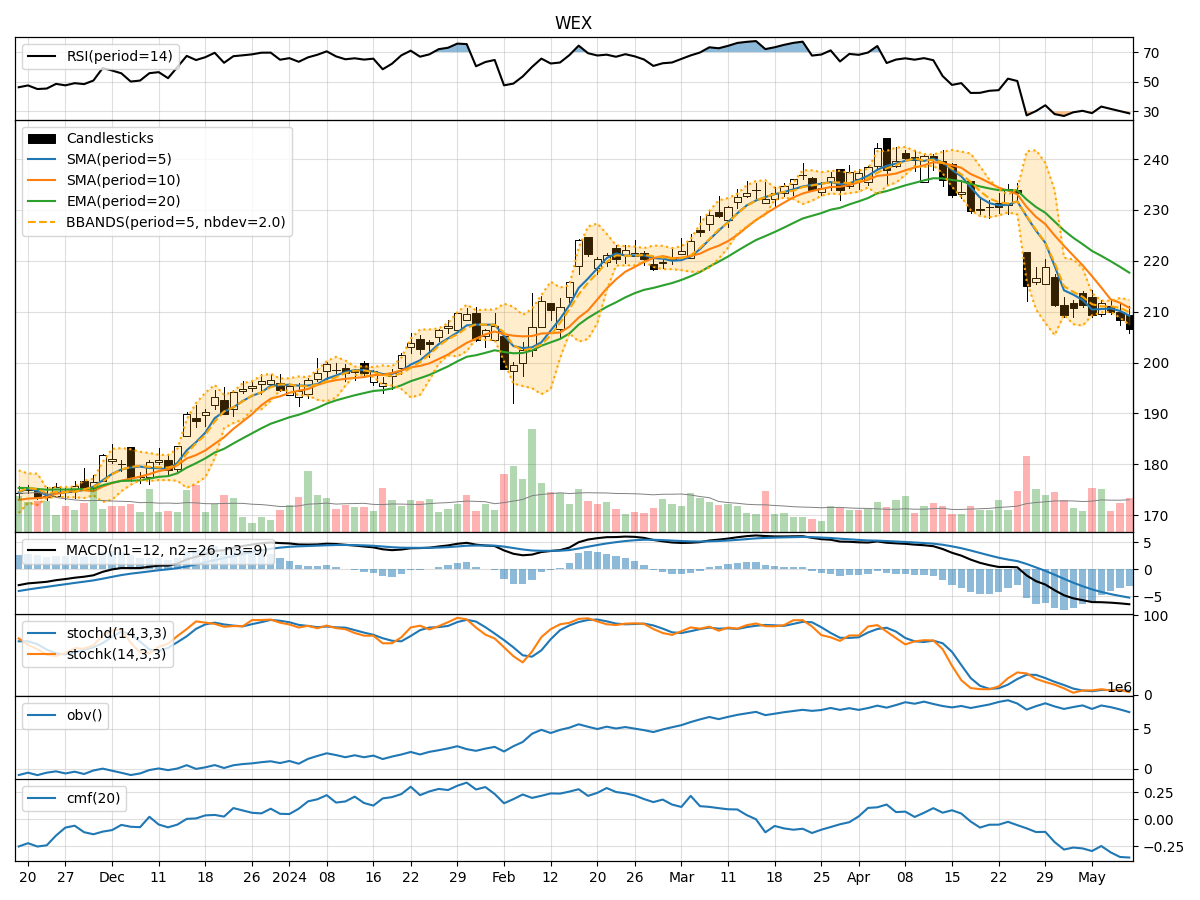
In the last 5 trading days, WEX stock has shown a downward trend in its closing price, accompanied by decreasing trading volume. The moving averages (MA) and exponential moving averages (EMA) have been declining, indicating a bearish trend. The MACD and momentum indicators also suggest a weakening momentum. Volatility has been relatively high, as seen in the Bollinger Bands, while volume indicators like OBV and CMF show a decrease in buying pressure.
Trend Analysis:
- Moving Averages (MA): The 5-day MA has been consistently below the longer-term SMAs, indicating a short-term bearish trend.
- MACD: The MACD line has been below the signal line, with both lines trending downwards, signaling a bearish momentum.
- EMA: The EMA has been declining, further confirming the bearish sentiment in the stock.
Momentum Analysis:
- RSI: The RSI has been decreasing, indicating weakening buying pressure.
- Stochastic Oscillator: Both %K and %D have been trending downwards, suggesting a bearish momentum.
- Williams %R: The indicator has been in oversold territory, indicating a potential reversal but still reflecting bearish sentiment.
Volatility Analysis:
- Bollinger Bands: The widening of the Bollinger Bands suggests increased volatility in the stock price.
- Bollinger %B: The %B indicator has been below 1, indicating the stock is trading below the lower Bollinger Band, potentially oversold.
Volume Analysis:
- On-Balance Volume (OBV): The OBV has been declining, indicating selling pressure and a decrease in buying volume.
- Chaikin Money Flow (CMF): The CMF has been negative, suggesting a lack of buying interest in the stock.
Conclusion:
Based on the technical indicators and analysis: - Trend: The stock is in a downtrend as indicated by moving averages and MACD. - Momentum: Momentum indicators suggest a bearish momentum in the stock. - Volatility: High volatility is present, which may lead to erratic price movements. - Volume: The decrease in buying pressure, as shown by OBV and CMF, indicates weak demand for the stock.
Forecast:
Given the bearish trend, momentum, and volume indicators, it is likely that WEX stock will continue its downward movement in the next few days. Traders and investors should exercise caution and consider shorting or staying away from long positions until there are clear signs of a trend reversal. It is advisable to closely monitor the price action and key support levels for any potential opportunities.