Technical Analysis of WF 2024-05-10
Overview:
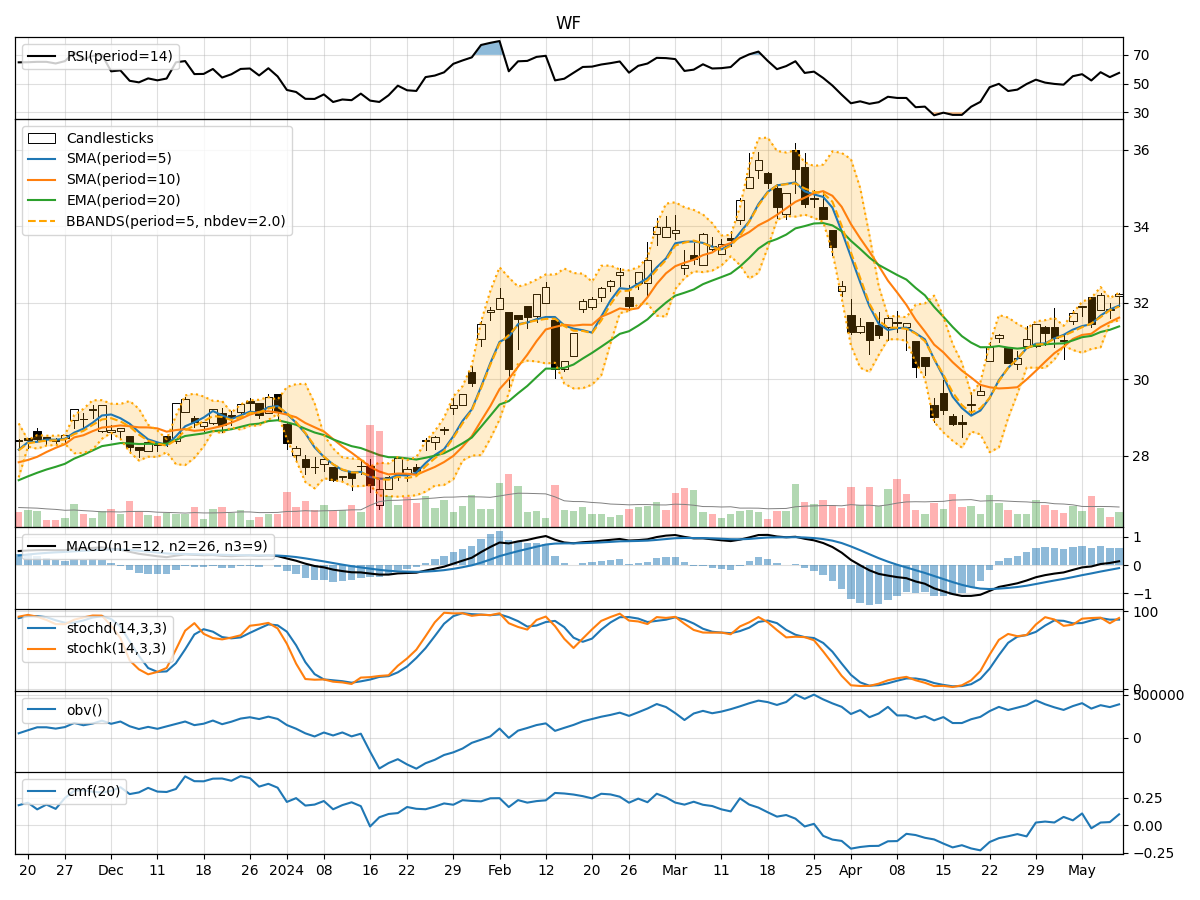
In analyzing the technical indicators for the stock WF over the last 5 days, we will delve into the trends, momentum, volatility, and volume indicators to provide a comprehensive outlook on the possible stock price movement in the coming days. By examining key metrics such as moving averages, MACD, RSI, Bollinger Bands, and OBV, we aim to offer valuable insights and recommendations for potential trading strategies.
Trend Indicators:
- Moving Averages (MA): The 5-day moving average has been trending upwards, indicating a positive short-term momentum.
- MACD: The MACD line has been consistently above the signal line, suggesting bullish momentum.
- MACD Histogram: The histogram has been increasing, indicating strengthening bullish momentum.
Momentum Indicators:
- RSI: The RSI has been fluctuating around the neutral level of 50, suggesting a lack of strong momentum in either direction.
- Stochastic Oscillator: Both %K and %D have been in overbought territory, indicating a potential reversal or consolidation.
- Williams %R: The indicator has been hovering around oversold levels, signaling a possible reversal to the upside.
Volatility Indicators:
- Bollinger Bands: The stock price has been trading within the bands, indicating normal volatility.
- Bollinger Band Width: The band width has been relatively stable, suggesting consistent volatility levels.
Volume Indicators:
- On-Balance Volume (OBV): The OBV has been showing mixed signals, with no clear trend in volume accumulation.
- Chaikin Money Flow (CMF): The CMF has been slightly positive, indicating some buying pressure but not significant.
Key Observations and Opinions:
- Trend: The stock is in an upward trend based on moving averages and MACD analysis.
- Momentum: Momentum indicators suggest a neutral to slightly bullish bias with potential for a reversal.
- Volatility: Volatility remains stable within Bollinger Bands, indicating no extreme price movements.
- Volume: Volume indicators show mixed signals with no clear accumulation or distribution pattern.
Conclusion:
Based on the analysis of the technical indicators, the next few days for WF stock are likely to see continued upward movement with a potential for consolidation or a minor pullback due to overbought conditions in the stochastic oscillator. Traders may consider buying on dips or waiting for a clear breakout above recent highs for a more definitive bullish signal. It is essential to monitor price action closely and consider risk management strategies to navigate potential market fluctuations.