Technical Analysis of WH 2024-05-10
Overview:
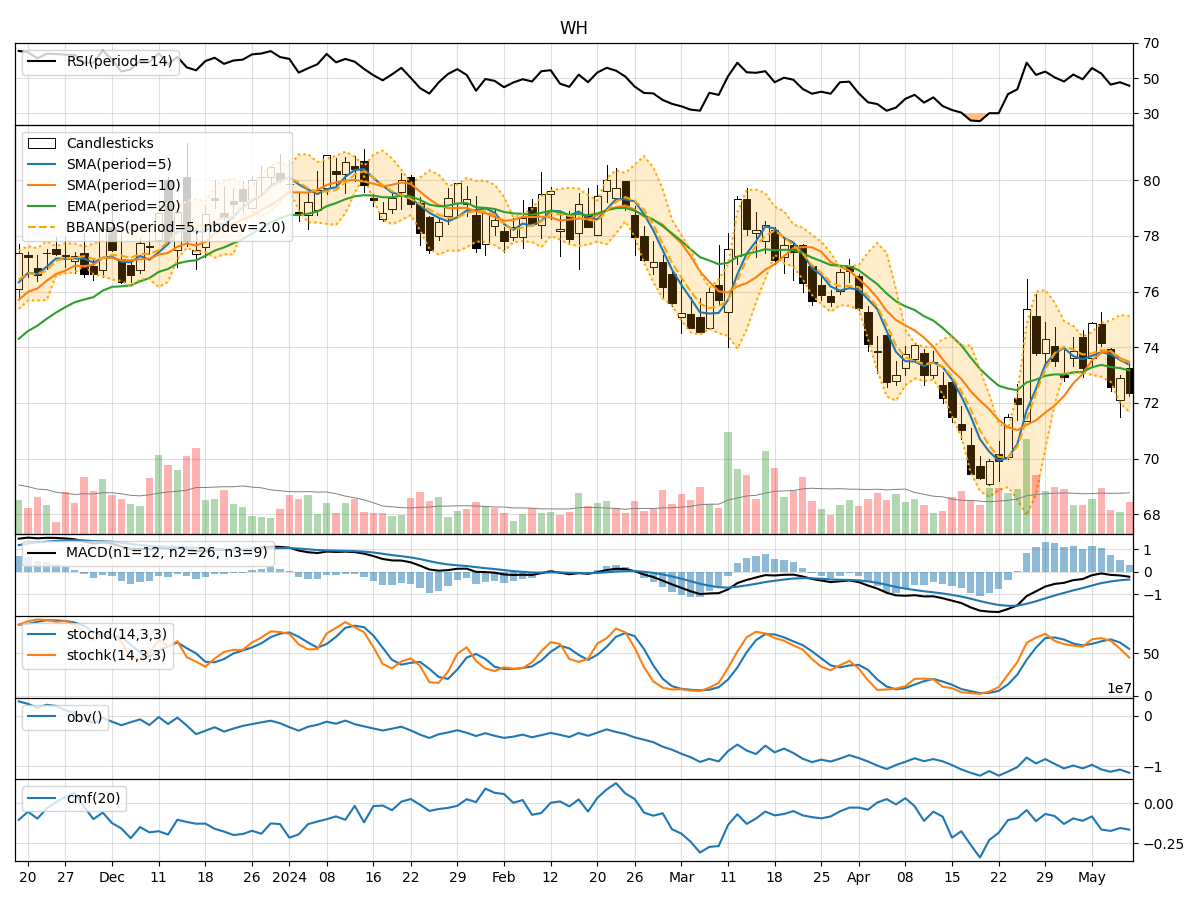
In analyzing the technical indicators for WH stock over the last 5 days, we will delve into the trend, momentum, volatility, and volume indicators to provide a comprehensive outlook on the possible stock price movement in the coming days. By examining these key indicators, we aim to offer valuable insights and predictions for potential investors.
Trend Analysis:
- Moving Averages (MA): The 5-day MA has been declining, indicating a short-term bearish trend.
- MACD: The MACD line has been consistently below the signal line, suggesting bearish momentum.
- EMA: The EMA has also been trending downwards, aligning with the bearish sentiment in the short term.
Momentum Analysis:
- RSI: The RSI has been decreasing, reflecting weakening momentum.
- Stochastic Oscillator: Both %K and %D have been declining, indicating a bearish momentum.
- Williams %R: The indicator has been in oversold territory, signaling a potential reversal.
Volatility Analysis:
- Bollinger Bands (BB): The bands have been widening, indicating increased volatility.
- BB %B: The %B has been decreasing, suggesting a potential oversold condition.
- BB Width: The widening of the bands implies higher volatility in the near term.
Volume Analysis:
- On-Balance Volume (OBV): The OBV has been decreasing, indicating selling pressure.
- Chaikin Money Flow (CMF): The CMF has been negative, reflecting outflow of money from the stock.
Key Observations:
- The stock is currently in a downtrend based on moving averages and MACD.
- Momentum indicators suggest bearish sentiment with RSI and Stochastic Oscillator pointing downwards.
- Volatility has increased, as seen in the widening Bollinger Bands, indicating higher price fluctuations.
- Volume indicators show selling pressure with OBV in decline and negative CMF.
Conclusion:
Based on the analysis of the technical indicators, the next few days for WH stock are likely to see further downside movement. The bearish trend, coupled with negative momentum and selling pressure, indicates a high probability of continued price decline. Investors should exercise caution and consider waiting for signs of a potential reversal before considering any long positions.