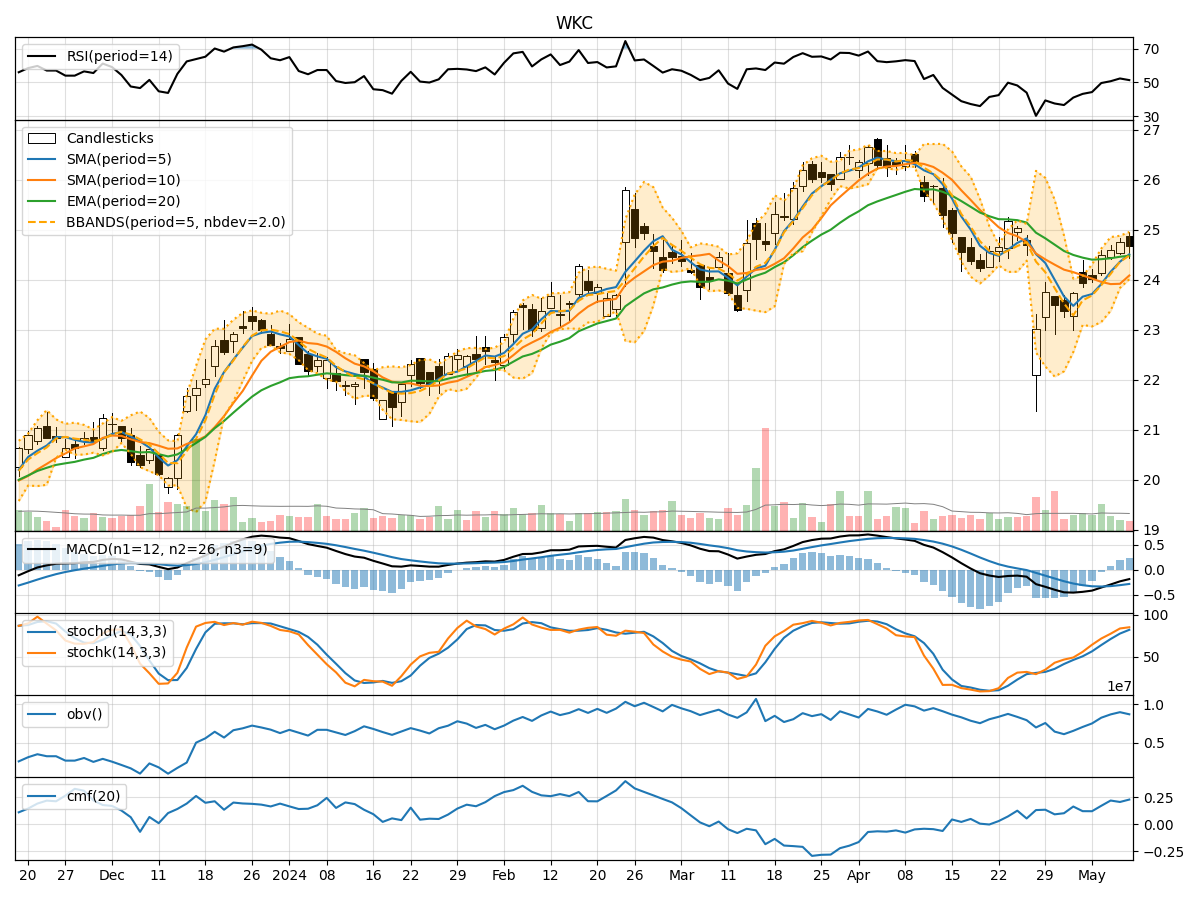
Technical Analysis of WKC 2024-05-10
Overview:
In analyzing the technical indicators for WKC over the last 5 days, we will delve into the trend, momentum, volatility, and volume indicators to provide a comprehensive outlook on the possible stock price movement. By examining these key aspects, we aim to offer valuable insights and predictions for the upcoming days.
Trend Analysis:
- Moving Averages (MA): The 5-day Moving Average (MA) has been trending above the closing prices, indicating a potential bullish sentiment in the short term.
- MACD: The Moving Average Convergence Divergence (MACD) has shown a negative trend, with the MACD line consistently below the signal line. This suggests a bearish momentum in the stock.
- EMA: The Exponential Moving Average (EMA) has been relatively stable, hovering around the closing prices, reflecting a neutral to slightly bearish outlook.
Momentum Analysis:
- RSI: The Relative Strength Index (RSI) has been fluctuating around the 50 level, indicating a balanced momentum between buying and selling pressure.
- Stochastic Oscillator: Both %K and %D lines of the Stochastic Oscillator have been in the overbought territory, suggesting a potential reversal or consolidation phase.
- Williams %R: The Williams %R indicator has been consistently in the oversold region, signaling a bearish sentiment in the market.
Volatility Analysis:
- Bollinger Bands: The Bollinger Bands have shown a narrowing of the bands, indicating decreasing volatility in the stock price.
- Bollinger %B: The %B indicator has been relatively stable, hovering around the midline, suggesting a period of consolidation.
- Average True Range (ATR): The ATR has shown a decrease in volatility, indicating a potential decrease in price fluctuations.
Volume Analysis:
- On-Balance Volume (OBV): The OBV indicator has shown mixed signals, with fluctuations in volume accumulation, reflecting indecision among market participants.
- Chaikin Money Flow (CMF): The CMF has been positive, indicating buying pressure in the market over the past 20 days.
Conclusion:
Based on the analysis of the technical indicators, the stock of WKC is currently exhibiting a mixed outlook: - Trend: The trend indicators suggest a neutral to slightly bearish sentiment. - Momentum: The momentum indicators point towards a potential reversal or consolidation phase. - Volatility: Volatility is decreasing, indicating a period of consolidation. - Volume: Volume indicators show mixed signals, reflecting indecision among investors.
Overall Assessment:
Considering the mixed signals from the technical indicators, the next few days for WKC are likely to see sideways movement with a slight bearish bias. Traders should exercise caution and closely monitor key support and resistance levels for potential entry or exit points. It is advisable to wait for more clarity in the market direction before making significant trading decisions.