Technical Analysis of WNS 2024-05-10
Overview:
In analyzing the technical indicators for WNS over the last 5 days, we will delve into the trend, momentum, volatility, and volume indicators to provide a comprehensive outlook on the possible stock price movement. By examining these key aspects, we aim to offer valuable insights and predictions for the upcoming days.
Trend Analysis:
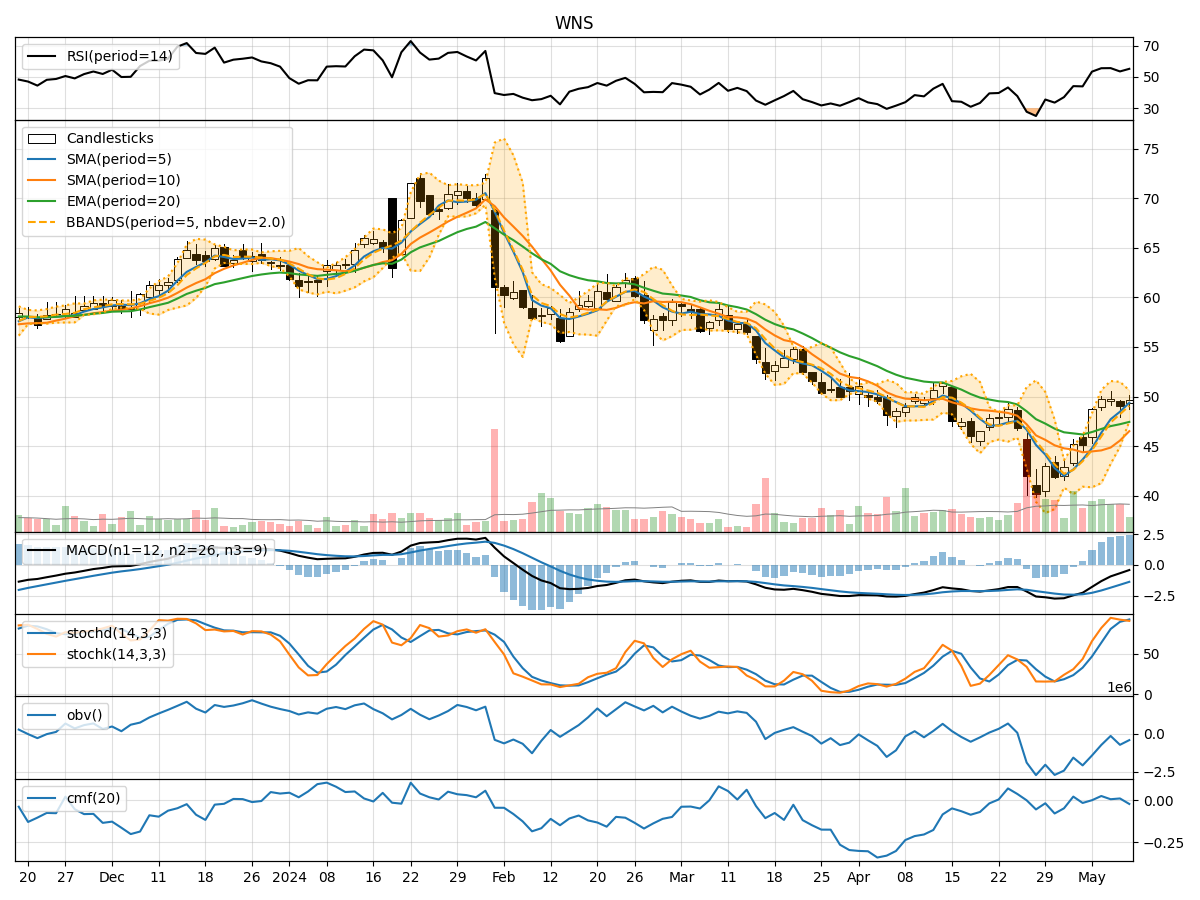
- Moving Averages (MA): The 5-day Moving Average has been consistently above the longer-term SMAs, indicating a bullish trend.
- MACD: The MACD line has been consistently above the signal line, suggesting a bullish momentum.
- RSI: The RSI values have been fluctuating around the neutral zone, indicating a balanced momentum.
Momentum Analysis:
- Stochastic Oscillator: The Stochastic Oscillator has been in the overbought region, suggesting a potential reversal or consolidation.
- Williams %R (WillR): The Williams %R has been fluctuating around the oversold and overbought levels, indicating mixed momentum.
Volatility Analysis:
- Bollinger Bands (BB): The Bollinger Bands have shown widening volatility, indicating potential price swings.
- Average True Range (ATR): The ATR values have been increasing, suggesting rising volatility in the stock.
Volume Analysis:
- On-Balance Volume (OBV): The OBV has shown mixed movements, indicating indecision among investors.
- Chaikin Money Flow (CMF): The CMF has been fluctuating around the zero line, suggesting a balance between buying and selling pressure.
Key Observations:
- The trend indicators suggest a bullish sentiment in the short term.
- Momentum indicators show mixed signals with a potential for a reversal.
- Volatility indicators point towards increasing price swings.
- Volume indicators reflect indecision among market participants.
Conclusion:
Based on the analysis of the technical indicators, the next few days' possible stock price movement for WNS is likely to experience a period of consolidation. The bullish trend may face resistance due to overbought conditions in the momentum indicators and increasing volatility. Investors should exercise caution and closely monitor key support and resistance levels for potential entry or exit points.