Technical Analysis of WOLF 2024-05-10
Overview:
In analyzing the technical indicators for WOLF stock over the last 5 days, we will delve into the trend, momentum, volatility, and volume indicators to provide a comprehensive outlook on the possible stock price movement in the coming days. By examining these key indicators, we aim to offer valuable insights and predictions for potential investors.
Trend Indicators:
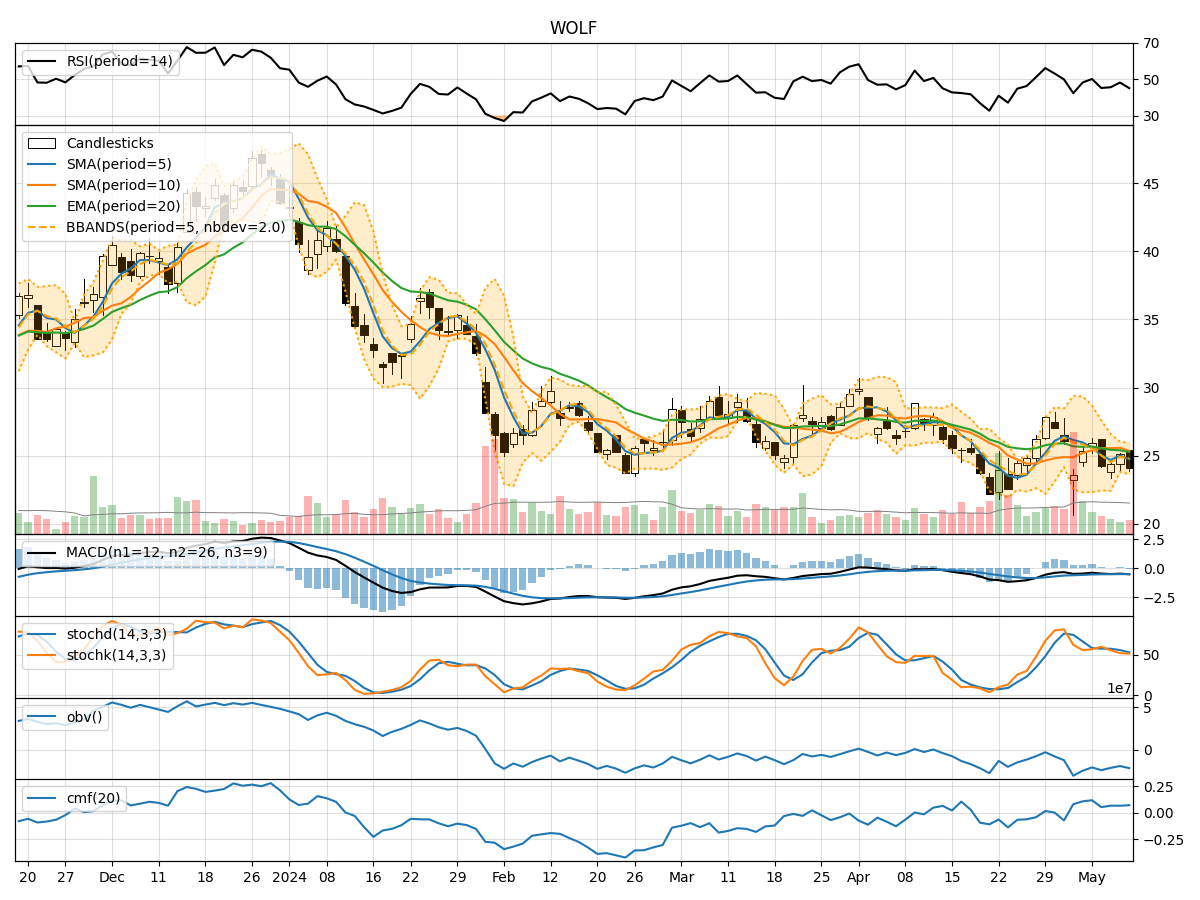
- Moving Averages (MA): The 5-day moving average (MA) has been fluctuating around the closing prices, indicating short-term price trends. The Simple Moving Average (SMA) and Exponential Moving Average (EMA) show a slight downward trend, suggesting a bearish sentiment.
- Moving Average Convergence Divergence (MACD): The MACD and Signal line have been negative, indicating a bearish momentum in the stock price.
- Conclusion: The trend indicators suggest a bearish outlook for the stock in the short term.
Momentum Indicators:
- Relative Strength Index (RSI): The RSI has been hovering around the neutral zone, indicating a lack of strong momentum in either direction.
- Stochastic Oscillator: Both %K and %D have been fluctuating, showing indecision in the market.
- Williams %R (Willams %R): The Williams %R is in the oversold territory, suggesting a potential reversal.
- Conclusion: The momentum indicators reflect a sideways movement with a slight bullish bias.
Volatility Indicators:
- Bollinger Bands (BB): The Bollinger Bands have been narrowing, indicating decreasing volatility and a potential price breakout.
- Conclusion: The volatility indicators suggest a potential breakout in the stock price in the near future.
Volume Indicators:
- On-Balance Volume (OBV): The OBV has been fluctuating, indicating mixed buying and selling pressure.
- Chaikin Money Flow (CMF): The CMF has been positive, suggesting some accumulation in the stock.
- Conclusion: The volume indicators show mixed signals with a slight bullish bias.
Overall Conclusion:
Based on the analysis of the technical indicators, the stock of WOLF is likely to experience further downside pressure in the short term due to the bearish trend and momentum indicators. However, the narrowing Bollinger Bands indicate a potential breakout, which could lead to a short-term bullish reversal. The volume indicators also suggest some accumulation in the stock, supporting the possibility of a price rebound.
Recommendation:
Considering the overall analysis, investors should exercise caution and closely monitor the stock price movement. It is advisable to wait for a clear breakout confirmation before considering any buying or selling decisions. Short-term traders may find opportunities in potential price reversals, while long-term investors should wait for a more stable trend to emerge before making significant moves.
Disclaimer:
This analysis is based solely on technical indicators and historical data, and it is important to consider other fundamental factors and market dynamics before making any investment decisions. It is recommended to consult with a financial advisor or conduct further research to validate the findings and tailor them to individual investment goals and risk tolerance levels.