Technical Analysis of WPP 2024-05-10
Overview:
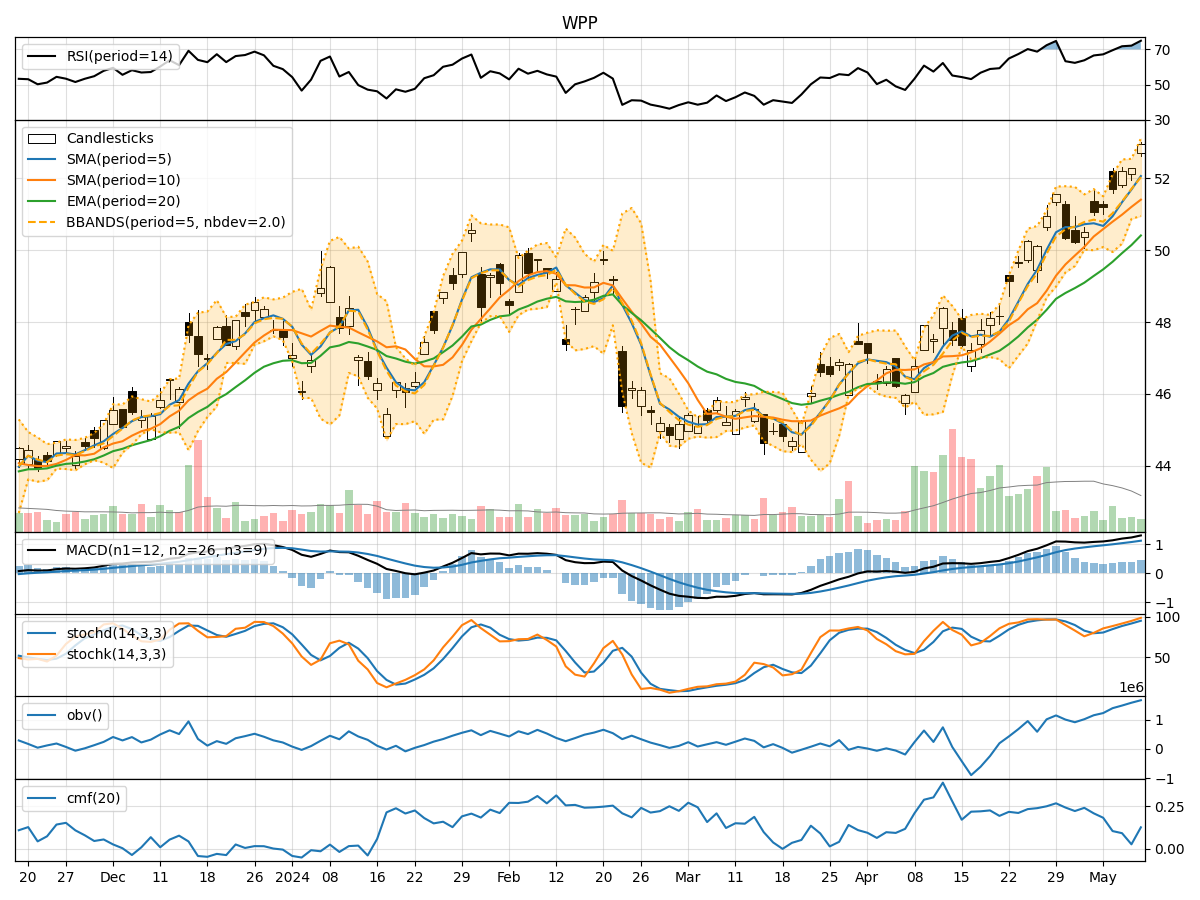
In analyzing the technical indicators for WPP stock over the last 5 days, we will delve into the trend, momentum, volatility, and volume indicators to provide a comprehensive outlook on the possible future stock price movement. By examining these key indicators, we aim to offer valuable insights and predictions for the upcoming trading days.
Trend Analysis:
- Moving Averages (MA): The 5-day Moving Average has been consistently rising, indicating a bullish trend in the short term.
- MACD: The MACD line has been above the signal line for the past 5 days, suggesting a bullish momentum.
- EMA: The Exponential Moving Average has also been trending upwards, supporting the bullish sentiment.
Key Observation: The trend indicators point towards a strong bullish trend in the stock price.
Momentum Analysis:
- RSI: The Relative Strength Index has been increasing and is currently in the overbought territory, signaling a strong buying momentum.
- Stochastic Oscillator: Both %K and %D lines are in the overbought zone, indicating a potential reversal or consolidation.
- Williams %R: The indicator is in the oversold region, suggesting a possible reversal in the short term.
Key Observation: The momentum indicators show a mixed signal with potential for a short-term reversal or consolidation.
Volatility Analysis:
- Bollinger Bands: The stock price has been trading near the upper Bollinger Band, indicating high volatility and a potential overbought condition.
- Bollinger %B: The %B indicator is above 0.8, suggesting an overbought market sentiment.
Key Observation: The volatility indicators signal high volatility and a potential pullback in the stock price.
Volume Analysis:
- On-Balance Volume (OBV): The OBV has been increasing, reflecting strong buying volume in the stock.
- Chaikin Money Flow (CMF): The CMF is positive, indicating that money is flowing into the stock.
Key Observation: The volume indicators support the bullish trend with increasing buying volume.
Conclusion:
Based on the analysis of the technical indicators, the overall outlook for WPP stock in the next few days is bullish. The trend indicators suggest a strong upward momentum, supported by increasing buying volume. However, the momentum indicators show a potential for a short-term reversal or consolidation, while the volatility indicators signal high volatility and a possible pullback. Traders and investors should closely monitor the price action and key support/resistance levels for potential entry or exit points.
Key Conclusion: The stock is likely to experience upward movement in the next few days, but caution is advised due to the potential for a short-term reversal indicated by momentum and volatility indicators.