Technical Analysis of WSM 2024-05-10
Overview:
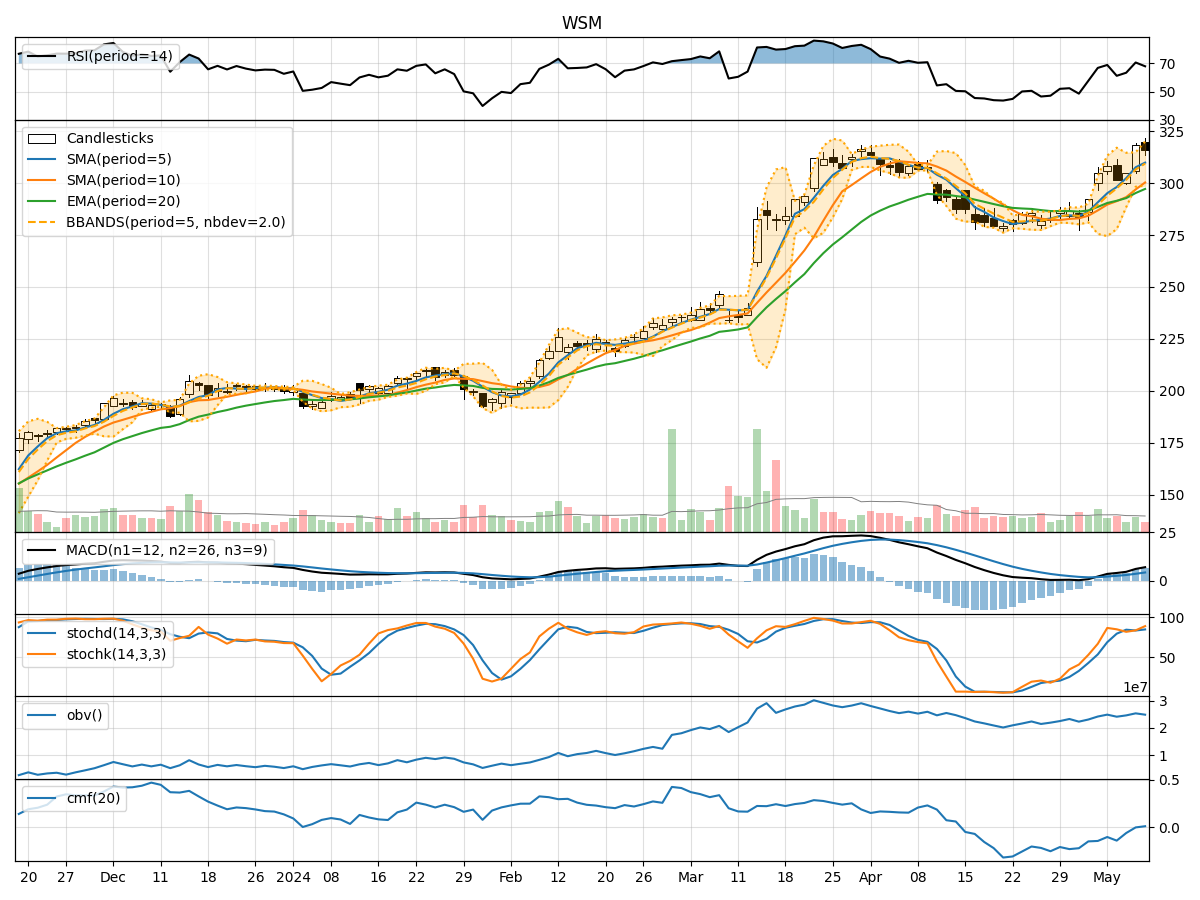
In analyzing the technical indicators for WSM over the last 5 days, we will delve into the trend, momentum, volatility, and volume indicators to provide a comprehensive outlook on the possible stock price movement in the coming days.
Trend Analysis:
- Moving Averages (MA): The 5-day Moving Average has been consistently above the Simple Moving Average (SMA) and Exponential Moving Average (EMA), indicating a bullish trend.
- MACD: The MACD line has been consistently above the signal line, with increasing values, suggesting a strengthening bullish momentum.
Momentum Analysis:
- RSI: The Relative Strength Index (RSI) has been fluctuating but generally staying within the neutral to overbought territory, indicating mixed momentum.
- Stochastic Oscillator: Both %K and %D have been in the overbought zone, suggesting a potential reversal or consolidation.
Volatility Analysis:
- Bollinger Bands (BB): The stock price has been mostly within the Bollinger Bands, with the bands widening slightly, indicating increased volatility.
Volume Analysis:
- On-Balance Volume (OBV): The OBV has shown slight fluctuations but has not diverged significantly from the price movement, indicating a balanced volume trend.
- Chaikin Money Flow (CMF): The CMF has been negative, suggesting some distribution in the stock.
Key Observations:
- The trend indicators suggest a strong bullish sentiment in the short term.
- Momentum indicators show a mixed picture with potential signs of overbought conditions.
- Volatility has increased slightly, indicating potential price swings.
- Volume indicators do not show significant divergence from price movement.
Conclusion:
Based on the analysis of the technical indicators, the stock price of WSM is likely to experience further upward movement in the coming days, supported by the bullish trend and momentum. However, caution is advised as the momentum indicators show signs of potential overbought conditions, which could lead to a short-term pullback or consolidation. Traders should closely monitor the price action and key support/resistance levels for timely decision-making.
Recommendation:
- Short-term Traders: Consider taking profits on existing long positions as the stock may experience a temporary pullback.
- Long-term Investors: Hold onto positions with a watchful eye on potential reversal signals from momentum indicators.
- Risk Management: Implement stop-loss orders to protect gains and manage risks effectively.
By combining insights from trend, momentum, volatility, and volume indicators, traders and investors can make informed decisions to navigate the dynamic stock market environment effectively.