Technical Analysis of XHR 2024-05-10
Overview:
In analyzing the technical indicators for XHR over the last 5 days, we will delve into the trend, momentum, volatility, and volume indicators to provide a comprehensive outlook on the possible stock price movement in the coming days. By examining these key aspects, we aim to offer valuable insights and predictions to guide your investment decisions.
Trend Analysis:
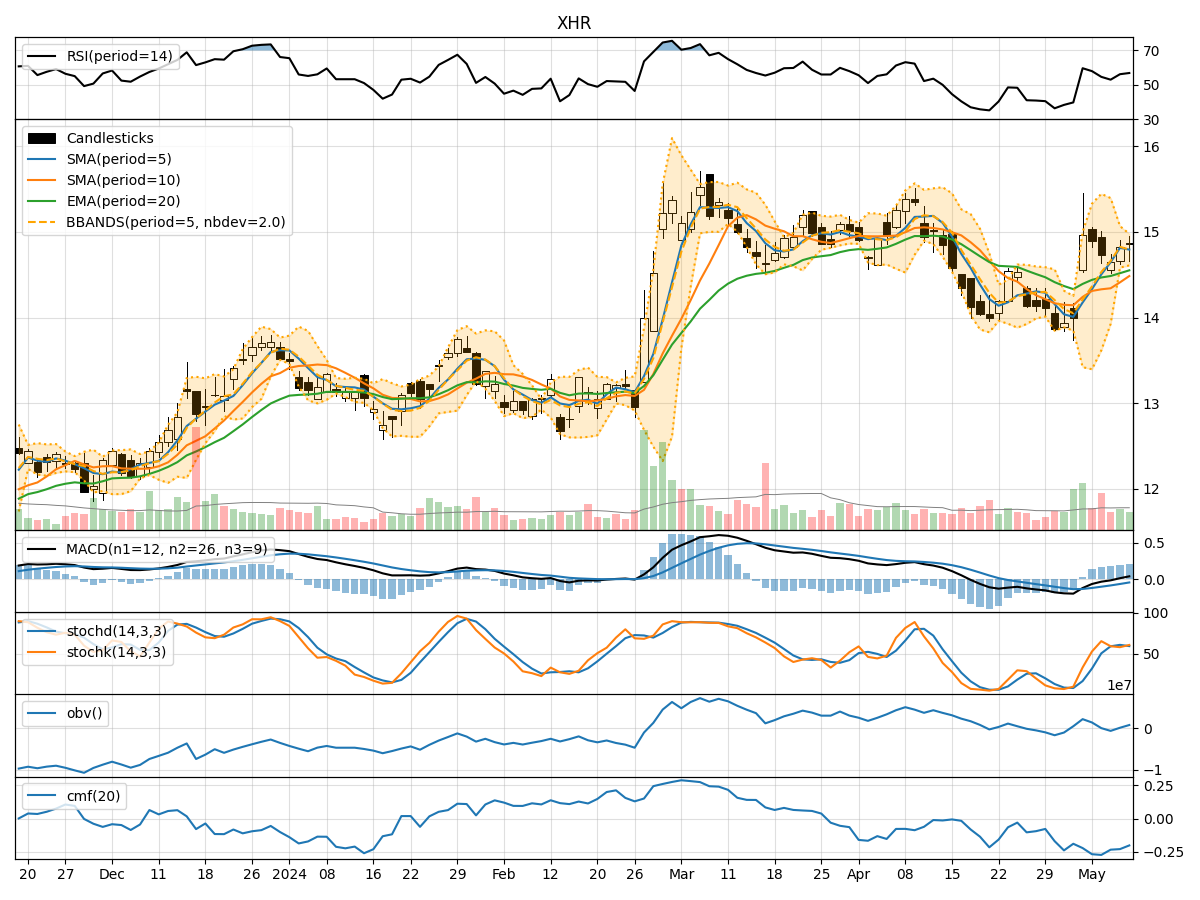
- Moving Averages (MA): The 5-day Moving Average (MA) has been consistently above the Simple Moving Average (SMA) and Exponential Moving Average (EMA), indicating a bullish trend.
- MACD: The MACD line has been consistently above the signal line, with the MACD histogram showing an increasing positive trend, suggesting bullish momentum.
Momentum Analysis:
- RSI: The Relative Strength Index (RSI) has been fluctuating around the 50 level, indicating a neutral momentum in the stock.
- Stochastic Oscillator: Both %K and %D lines of the Stochastic Oscillator have been hovering around the mid-level, suggesting a lack of strong momentum in either direction.
Volatility Analysis:
- Bollinger Bands (BB): The Bollinger Bands have been narrowing, indicating decreasing volatility in the stock price.
- Bollinger %B: The %B indicator has been fluctuating within a tight range, reflecting the consolidation phase in the stock.
Volume Analysis:
- On-Balance Volume (OBV): The OBV indicator has shown a slight increase over the last few days, suggesting some accumulation by investors.
- Chaikin Money Flow (CMF): The CMF has been negative, indicating a slight outflow of money from the stock.
Key Observations:
- The trend indicators suggest a bullish sentiment in the stock, supported by the moving averages and MACD.
- Momentum indicators show a lack of strong momentum in either direction, indicating a neutral stance.
- Volatility has been decreasing, leading to a consolidation phase in the stock price.
- Volume indicators reflect some accumulation but with a slight outflow of money, signaling mixed investor sentiment.
Conclusion:
Based on the analysis of the technical indicators, the next few days for XHR are likely to see sideways movement with a slight bullish bias. The stock may continue to consolidate within a narrow range, with limited volatility and momentum. Investors should closely monitor key support and resistance levels for potential breakout opportunities. It is advisable to exercise caution and wait for clearer signals before making significant trading decisions.