Technical Analysis of XYF 2024-05-10
Overview:
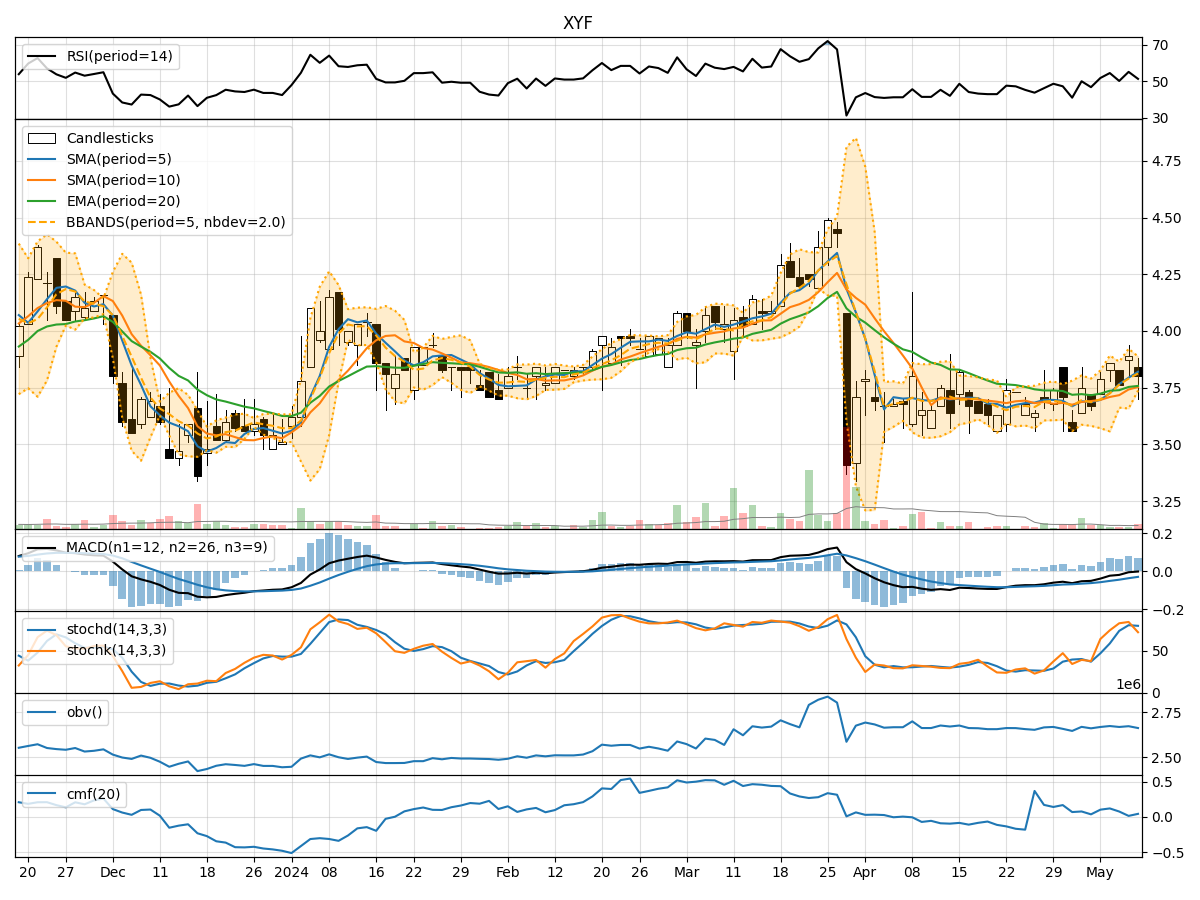
In analyzing the technical indicators for XYF over the last 5 days, we will delve into the trend, momentum, volatility, and volume indicators to provide a comprehensive outlook on the possible stock price movement in the coming days.
Trend Analysis:
- Moving Averages (MA): The 5-day Moving Average (MA) has been trending above the Simple Moving Average (SMA) and Exponential Moving Average (EMA) over the past 5 days, indicating a short-term bullish trend.
- MACD: The Moving Average Convergence Divergence (MACD) has been positive, with the MACD line consistently above the signal line, suggesting bullish momentum.
- Conclusion: The trend indicators point towards a bullish trend for XYF in the short term.
Momentum Analysis:
- RSI: The Relative Strength Index (RSI) has been fluctuating around the 50 level, indicating a neutral momentum.
- Stochastic Oscillator: Both %K and %D have shown variability but have not reached extreme levels, suggesting a lack of strong momentum.
- Conclusion: The momentum indicators suggest a neutral momentum for XYF currently.
Volatility Analysis:
- Bollinger Bands (BB): The stock price has mostly stayed within the Bollinger Bands, with the bands narrowing in recent days, indicating decreasing volatility.
- Conclusion: Volatility has been decreasing, and the stock is likely to experience sideways movement or consolidation in the near future.
Volume Analysis:
- On-Balance Volume (OBV): The OBV has shown mixed movements, indicating indecision among market participants.
- Chaikin Money Flow (CMF): The CMF has been relatively low, suggesting a lack of strong buying or selling pressure.
- Conclusion: Volume indicators reflect a neutral sentiment among investors.
Overall Conclusion:
Based on the analysis of trend, momentum, volatility, and volume indicators, the next few days for XYF are likely to see sideways movement or consolidation. The bullish trend indicated by the moving averages and MACD may be limited by the neutral momentum and volume indicators. The decreasing volatility also supports the view of a period of consolidation.
Recommendation:
Given the current market dynamics and technical indicators, it is advisable to exercise caution and closely monitor XYF for any breakout or trend reversal signals. Traders may consider implementing range-bound strategies, while investors may opt to wait for clearer signals before making significant moves.
Disclaimer:
Remember that technical analysis is not foolproof and should be used in conjunction with other forms of analysis. Market conditions can change rapidly, so it is essential to stay informed and adapt your strategies accordingly.