Technical Analysis of YELP 2024-05-10
Overview:
In analyzing the technical indicators for Yelp Inc. (YELP) over the last 5 days, we will delve into the trends, momentum, volatility, and volume indicators to provide insights into the possible future stock price movements. By examining these key indicators, we aim to offer a comprehensive analysis and make informed predictions for the upcoming days.
Trend Analysis:
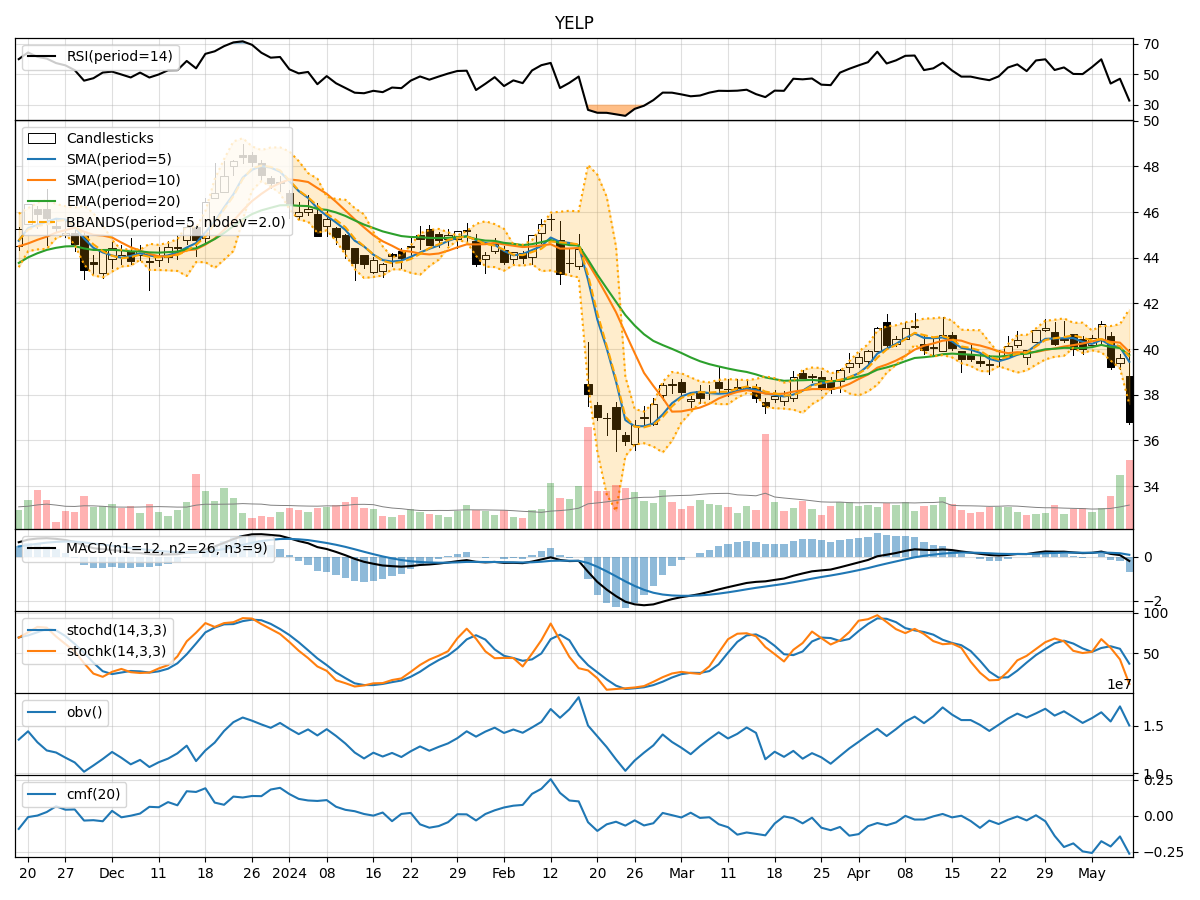
- Moving Averages (MA): The 5-day Moving Average (MA) has been fluctuating around the closing prices, indicating short-term price trends. The Simple Moving Average (SMA) and Exponential Moving Average (EMA) have shown some divergence, suggesting potential shifts in momentum.
- MACD: The Moving Average Convergence Divergence (MACD) has been negative, with the MACD line below the signal line. This indicates a bearish trend in the stock price.
- Conclusion: The trend indicators suggest a bearish outlook for YELP in the short term.
Momentum Analysis:
- RSI: The Relative Strength Index (RSI) has been hovering around the mid-range, indicating a lack of strong momentum in either direction.
- Stochastic Oscillator: Both %K and %D have been fluctuating, showing indecision in the market momentum.
- Conclusion: The momentum indicators suggest a sideways movement or lack of clear direction for YELP in the near future.
Volatility Analysis:
- Bollinger Bands (BB): The Bollinger Bands have widened, indicating increased volatility in the stock price. The bands have not shown any significant contraction or expansion trends.
- Conclusion: The volatility indicators suggest increased volatility in YELP, which could lead to larger price swings in the upcoming days.
Volume Analysis:
- On-Balance Volume (OBV): The OBV has shown mixed signals, with no clear trend in volume accumulation or distribution.
- Chaikin Money Flow (CMF): The CMF has been negative, indicating potential selling pressure in the stock.
- Conclusion: The volume indicators suggest mixed signals in terms of volume accumulation and selling pressure for YELP.
Overall Conclusion:
Based on the analysis of the technical indicators, the bearish trend indicated by the moving averages and MACD, coupled with the sideways momentum and increased volatility, suggests that YELP may experience further downward price movement in the next few days. Traders and investors should exercise caution and consider risk management strategies in light of the current market dynamics.
Key Takeaways:
- Trend: Bearish
- Momentum: Sideways
- Volatility: Increased
- Volume: Mixed signals
Disclaimer:
This analysis is based solely on technical indicators and historical data, and market conditions can change rapidly. It is essential to conduct thorough research and consider other factors before making any investment decisions. Consulting with a financial advisor is recommended to align investment strategies with individual goals and risk tolerance levels.