Technical Analysis of YETI 2024-05-10
Overview:
In analyzing the technical indicators for YETI over the last 5 days, we will delve into the trend, momentum, volatility, and volume indicators to provide a comprehensive outlook on the possible stock price movement. By examining these key factors, we aim to offer valuable insights and predictions for the upcoming days.
Trend Analysis:
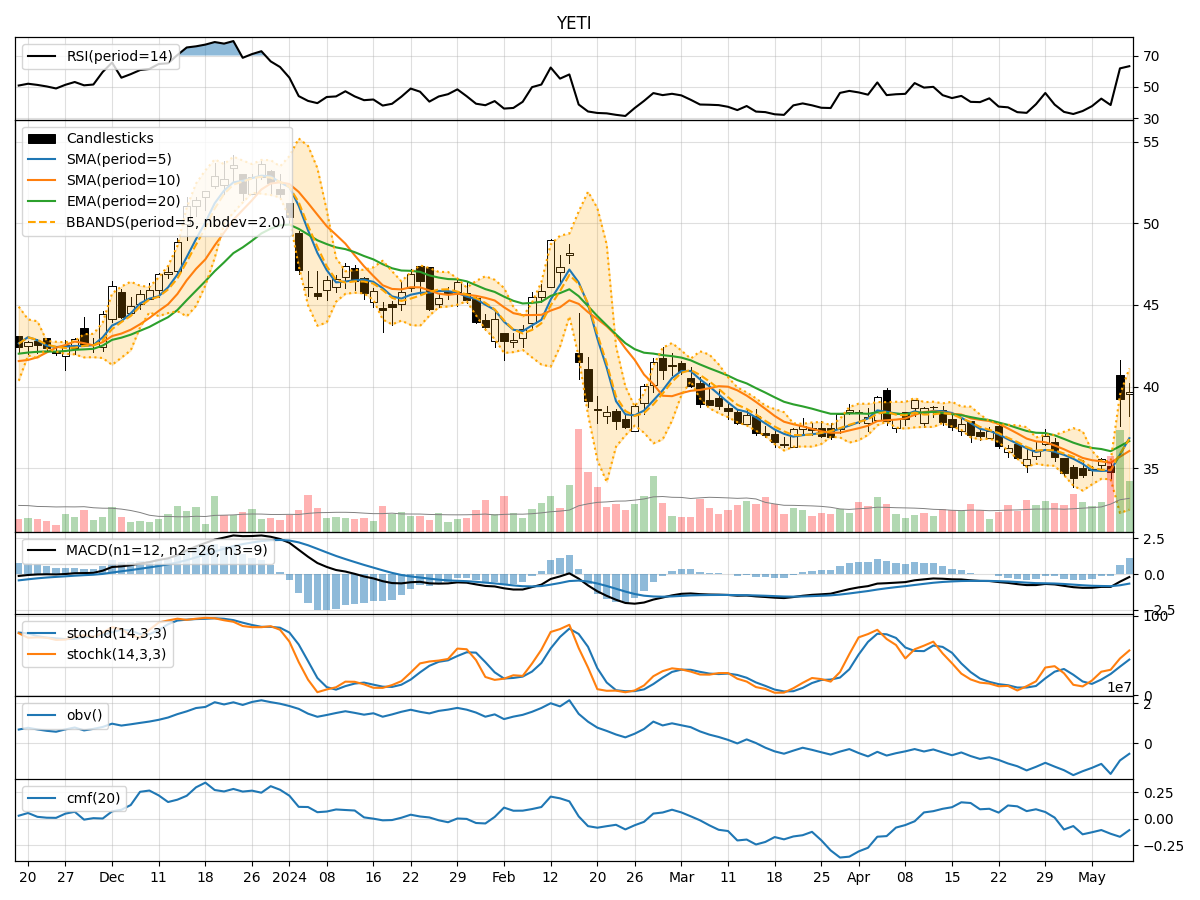
- Moving Averages (MA): The 5-day MA has been fluctuating around the closing prices, indicating short-term price trends. The SMA(10) and EMA(20) show a downward trend, suggesting a bearish sentiment in the medium to long term.
- MACD: The MACD line has been negative, with the MACD histogram showing a decreasing trend. This indicates a bearish momentum in the stock price.
- Conclusion: The trend indicators suggest a bearish outlook for YETI in the near future.
Momentum Analysis:
- RSI: The RSI has been relatively low, indicating oversold conditions in the market.
- Stochastic Oscillator: Both %K and %D have been increasing, showing a potential bullish momentum.
- Williams %R: The indicator has been improving, moving away from oversold levels.
- Conclusion: Momentum indicators suggest a potential reversal in the stock's momentum towards a bullish direction.
Volatility Analysis:
- Bollinger Bands: The bands have widened, indicating increased volatility in the stock price.
- Conclusion: Volatility indicators suggest higher volatility in the upcoming days, which could lead to significant price movements.
Volume Analysis:
- On-Balance Volume (OBV): The OBV has been decreasing, indicating selling pressure in the market.
- Chaikin Money Flow (CMF): The CMF has been negative, reflecting a lack of buying interest.
- Conclusion: Volume indicators suggest a bearish sentiment in the market due to higher selling pressure.
Overall Conclusion:
Based on the analysis of trend, momentum, volatility, and volume indicators, the overall outlook for YETI in the next few days is bearish. The trend indicators point towards a downward trajectory, while momentum indicators hint at a potential bullish reversal. However, the high volatility and bearish volume signals outweigh the bullish momentum, indicating a higher probability of further downside movement in the stock price.
Recommendation:
Considering the comprehensive analysis of technical indicators, it is advisable to exercise caution when trading YETI in the upcoming days. Traders should closely monitor the price action for any potential reversal signals before considering long positions. Short-term traders may find opportunities to capitalize on the increased volatility, but long-term investors should wait for more clarity in the market sentiment before making significant investment decisions.