Technical Analysis of YSG 2024-05-10
Overview:
In analyzing the technical indicators for YSG stock over the last 5 days, we will delve into the trend, momentum, volatility, and volume indicators to provide a comprehensive outlook on the possible stock price movement in the coming days. By examining these key indicators, we aim to offer valuable insights and predictions for potential investors.
Trend Analysis:
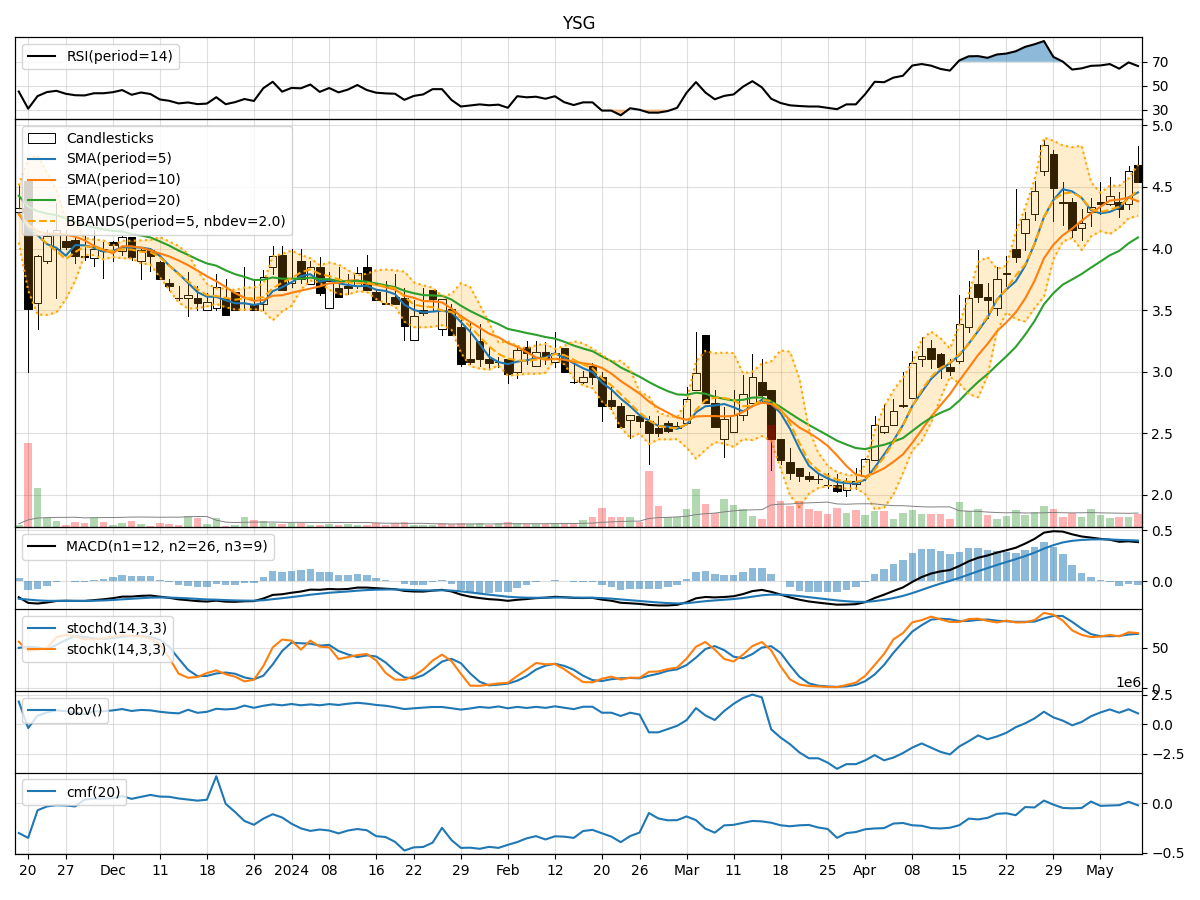
- Moving Averages (MA): The 5-day Moving Average (MA) has been consistently above the Simple Moving Average (SMA) and Exponential Moving Average (EMA), indicating a short-term uptrend.
- MACD: The MACD line has been above the signal line, suggesting bullish momentum in the stock price.
- MACD Histogram: The MACD Histogram has been fluctuating around the zero line, indicating a potential consolidation phase.
Momentum Analysis:
- RSI: The Relative Strength Index (RSI) has been oscillating in the overbought territory, signaling a strong bullish momentum.
- Stochastic Oscillator: Both %K and %D lines of the Stochastic Oscillator have been in the overbought zone, indicating a potential reversal or consolidation.
- Williams %R: The Williams %R has been hovering in the oversold region, suggesting a possible bullish reversal.
Volatility Analysis:
- Bollinger Bands (BB): The stock price has been trading within the Bollinger Bands, with the bands widening slightly, indicating increased volatility.
- Bollinger %B: The Bollinger %B has been fluctuating around 0.5, suggesting a neutral stance in terms of volatility.
Volume Analysis:
- On-Balance Volume (OBV): The OBV has shown mixed signals with fluctuations, indicating indecision among market participants.
- Chaikin Money Flow (CMF): The CMF has been negative, suggesting a bearish pressure on the stock price.
Key Observations:
- The trend indicators point towards a short-term uptrend in the stock price.
- Momentum indicators show conflicting signals with overbought and oversold conditions, indicating a potential reversal or consolidation.
- Volatility has slightly increased, suggesting potential price swings in the coming days.
- Volume indicators reflect mixed sentiments among investors, with no clear direction in terms of buying or selling pressure.
Conclusion:
Based on the analysis of the technical indicators, the stock price of YSG is likely to experience further upward movement in the near term. However, given the conflicting signals from momentum indicators and the negative CMF, there might be a period of consolidation or a minor pullback before resuming the uptrend. Traders should closely monitor key support and resistance levels for potential entry and exit points.