Technical Analysis of ZETA 2024-05-10
Overview:
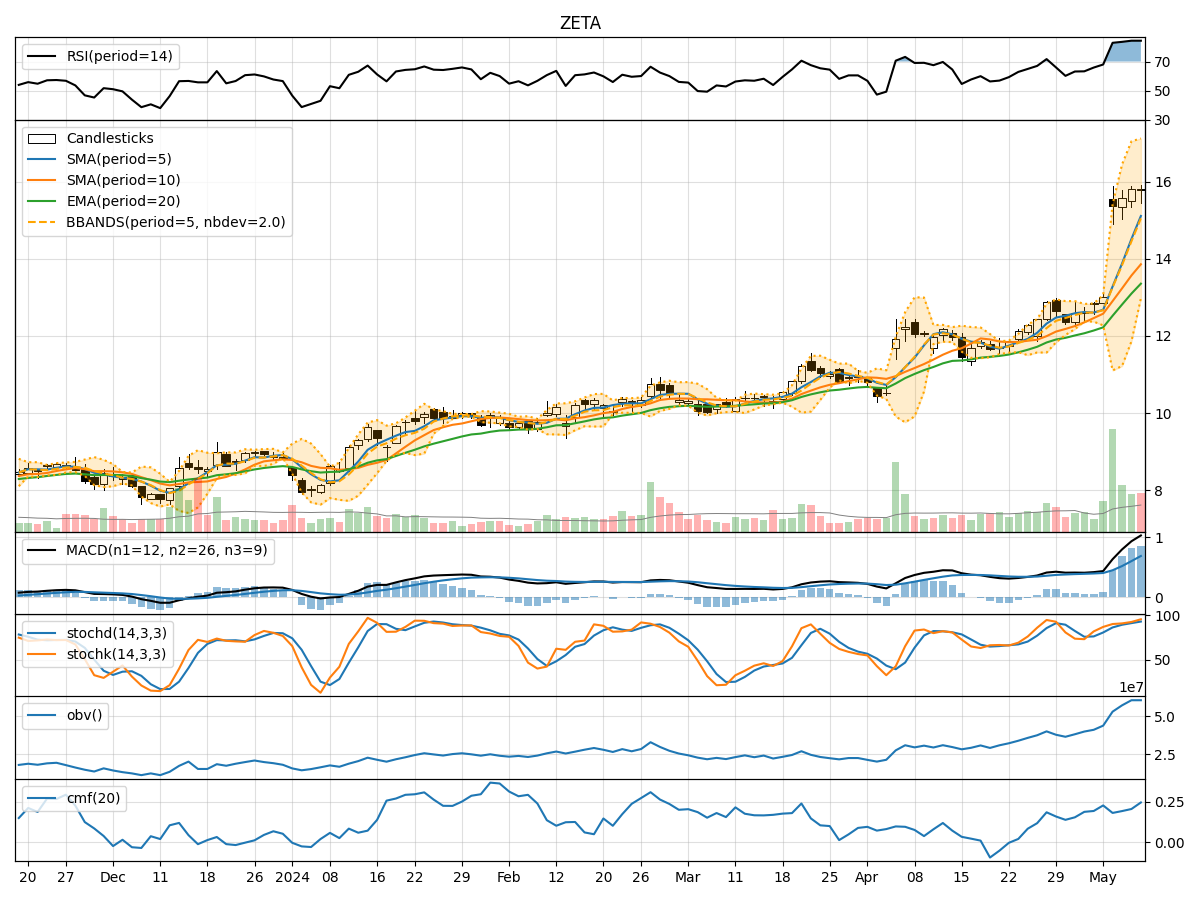
In analyzing the technical indicators for ZETA stock over the last 5 days, we will delve into the trends, momentum, volatility, and volume aspects to provide a comprehensive outlook on the possible stock price movement in the coming days.
Trend Analysis:
- Moving Averages (MA): The 5-day Moving Average has been consistently rising, indicating an upward trend in the stock price.
- MACD: The MACD line has been above the signal line, suggesting a bullish momentum in the stock.
- EMA: The Exponential Moving Average has also been trending upwards, supporting the bullish sentiment.
Momentum Analysis:
- RSI: The Relative Strength Index has been in the overbought territory, indicating a strong bullish momentum.
- Stochastic Oscillator: Both %K and %D have been in the overbought zone, signaling a potential reversal or consolidation.
- Williams %R: The indicator has been in the oversold region, suggesting a possible reversal in the stock price.
Volatility Analysis:
- Bollinger Bands: The stock price has been consistently trading above the upper Bollinger Band, indicating overbought conditions and a potential pullback.
- Bollinger %B: The %B indicator has been above 1, further confirming the overbought status of the stock.
Volume Analysis:
- On-Balance Volume (OBV): The OBV has been steadily increasing, reflecting strong buying pressure in the stock.
- Chaikin Money Flow (CMF): The CMF has been positive, indicating that money is flowing into the stock.
Key Observations and Opinions:
- Trend: The stock is in a strong uptrend based on moving averages and MACD.
- Momentum: The RSI and Stochastic indicators suggest that the stock is overbought and may experience a pullback or consolidation.
- Volatility: The Bollinger Bands and %B indicator point towards overbought conditions, signaling a potential reversal.
- Volume: The increasing OBV and positive CMF indicate strong buying interest in the stock.
Conclusion:
Based on the technical analysis of ZETA stock, the stock price is likely to experience a short-term pullback or consolidation after the recent bullish rally. Traders should exercise caution and consider taking profits or waiting for a better entry point. The overbought conditions indicated by various momentum and volatility indicators suggest a potential reversal in the stock price in the coming days.