Technical Analysis of ZGN 2024-05-10
Overview:
In analyzing the technical indicators for ZGN over the last 5 days, we will delve into the trend, momentum, volatility, and volume indicators to provide a comprehensive assessment of the stock's potential price movement. By examining these key factors, we aim to offer valuable insights and predictions for the next few days.
Trend Analysis:
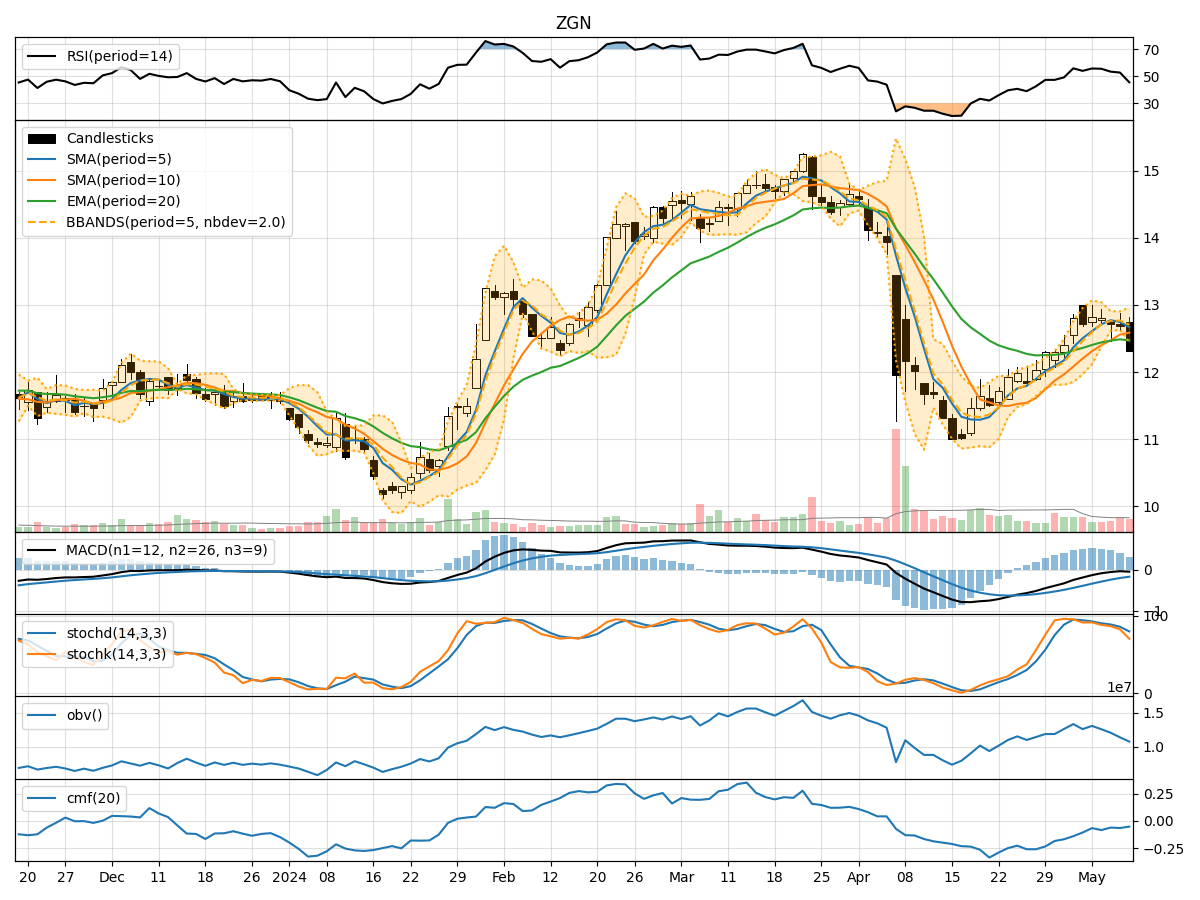
- Moving Averages (MA): The 5-day Moving Average (MA) has been fluctuating around the closing prices, indicating short-term price trends. The Simple Moving Average (SMA) and Exponential Moving Average (EMA) show a slight uptrend but with recent convergence.
- MACD: The Moving Average Convergence Divergence (MACD) has been negative, suggesting a bearish momentum. However, the MACD Histogram (MACDH) has shown some positive values, hinting at a potential reversal.
Momentum Analysis:
- RSI: The Relative Strength Index (RSI) has been declining, indicating weakening momentum. The current value is below 50, signaling a bearish sentiment.
- Stochastic Oscillator: Both %K and %D values have been decreasing, moving towards oversold territory. This suggests a potential reversal or consolidation phase.
- Williams %R: The Williams %R is in oversold territory, indicating a possible buying opportunity in the near term.
Volatility Analysis:
- Bollinger Bands (BB): The Bollinger Bands have been narrowing, indicating decreasing volatility. The bands are currently close to the price, suggesting a potential breakout or significant price movement.
- Bollinger %B: The %B indicator is near the lower band, signaling a possible oversold condition and a potential bounce back.
Volume Analysis:
- On-Balance Volume (OBV): The OBV has been fluctuating, showing mixed buying and selling pressure. The recent negative OBV values suggest distribution.
- Chaikin Money Flow (CMF): The CMF has been negative, indicating outflows and potential bearish sentiment in the market.
Conclusion:
Based on the analysis of the technical indicators, the next few days for ZGN are likely to see further downward movement. The trend indicators show a potential bearish reversal, supported by weakening momentum and negative volume indicators. The narrowing Bollinger Bands suggest a breakout is imminent, possibly to the downside. Traders should exercise caution and consider short-term selling opportunities or wait for a clearer trend confirmation before entering any positions.