Technical Analysis of ZKH 2024-05-10
Overview:
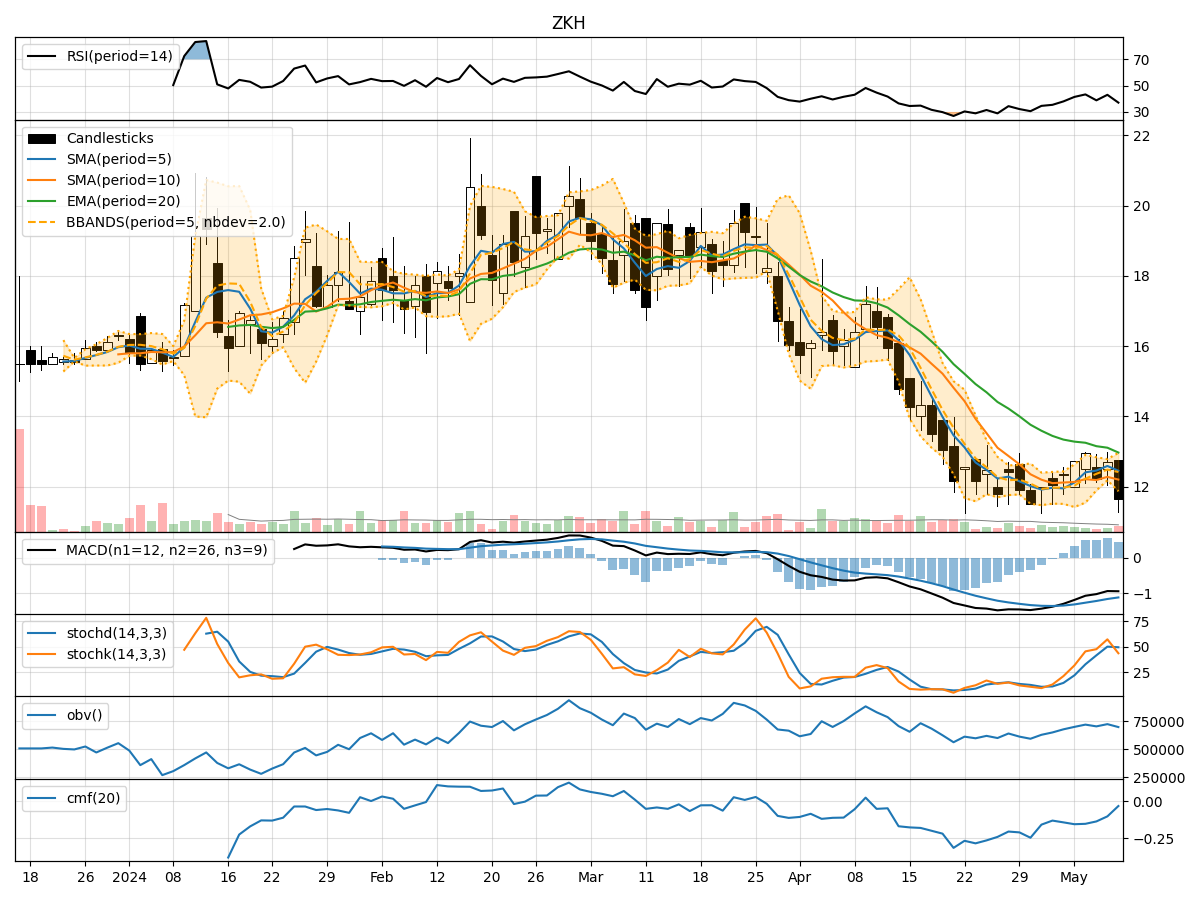
In analyzing the technical indicators for ZKH stock over the last 5 days, we will delve into the trends, momentum, volatility, and volume aspects to provide a comprehensive outlook on the possible stock price movement in the coming days. By examining key indicators such as moving averages, MACD, RSI, Bollinger Bands, and OBV, we aim to offer valuable insights and predictions for potential price action.
Trend Analysis:
- Moving Averages (MA): The 5-day moving average has been fluctuating, indicating some volatility in the short term.
- MACD: The MACD line has been consistently below the signal line, suggesting a bearish trend.
- EMA: The exponential moving average has been declining, reflecting a downward trend in the stock price.
Momentum Analysis:
- RSI: The Relative Strength Index has been hovering around the mid-range, indicating a lack of strong momentum in either direction.
- Stochastic Oscillator: Both %K and %D have shown mixed signals, with no clear indication of overbought or oversold conditions.
- Williams %R: The Williams %R is in the oversold territory, suggesting a potential reversal or bounce in the stock price.
Volatility Analysis:
- Bollinger Bands: The Bollinger Bands have widened, indicating increased volatility in the stock price.
- Bollinger %B: The %B indicator is near the lower band, signaling a possible oversold condition.
- Bollinger Band Width: The band width has expanded, suggesting a higher degree of price fluctuation.
Volume Analysis:
- On-Balance Volume (OBV): The OBV has been declining, indicating selling pressure in the stock.
- Chaikin Money Flow (CMF): The CMF is negative, suggesting outflows from the stock.
Key Observations and Opinions:
- Trend: The stock is currently in a downtrend based on moving averages and MACD.
- Momentum: Momentum indicators show mixed signals, with RSI indicating neutrality and Williams %R in the oversold zone.
- Volatility: Increased volatility as indicated by Bollinger Bands widening.
- Volume: Declining OBV and negative CMF point towards bearish sentiment.
Conclusion:
Based on the analysis of technical indicators, the next few days' possible stock price movement for ZKH is likely to be bearish. The downtrend indicated by moving averages and MACD, coupled with negative volume indicators, suggests a continuation of the current bearish momentum. Traders and investors should exercise caution and consider short-term selling strategies or wait for a clearer reversal signal before considering long positions.