Technical Analysis of MBSD 2024-05-10
Overview:
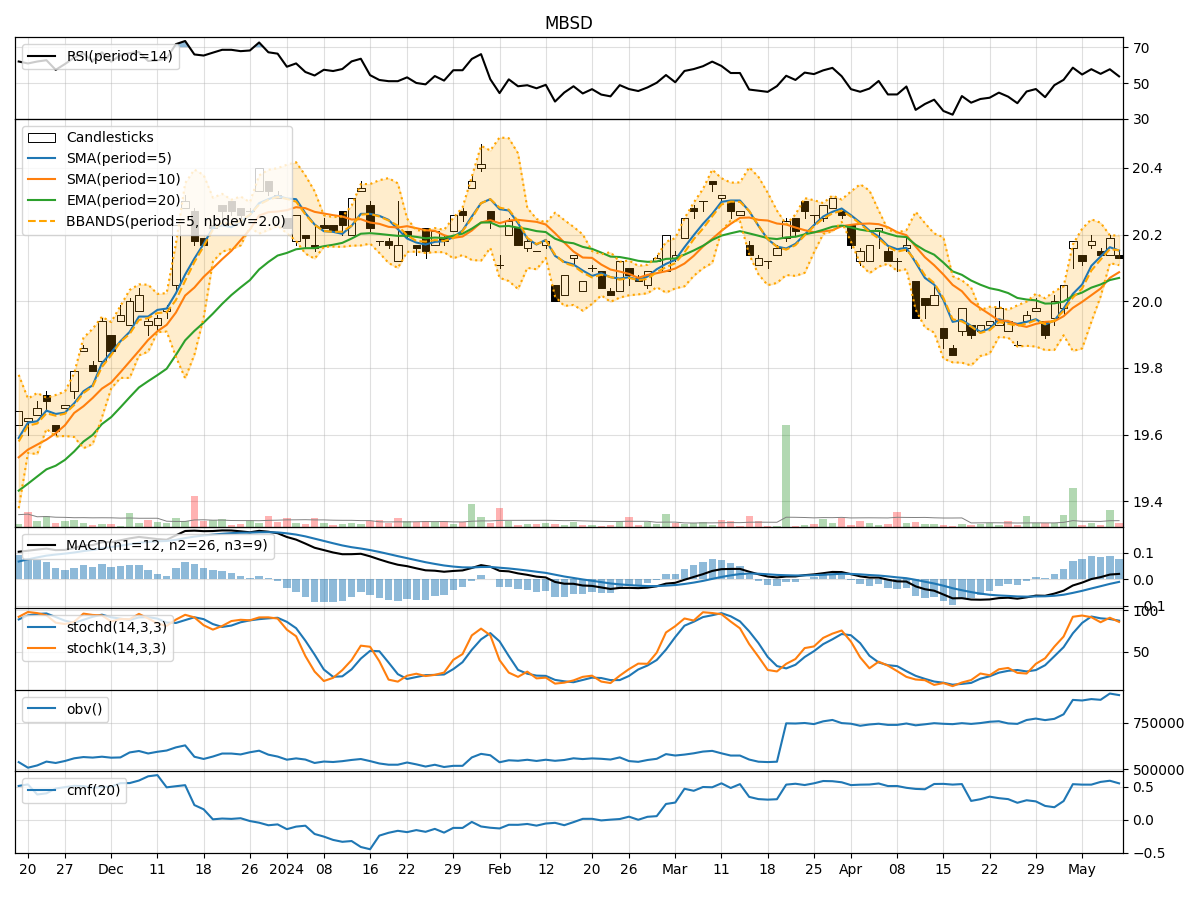
In analyzing the technical indicators for MBSD stock over the last 5 days, we will delve into the trend, momentum, volatility, and volume indicators to provide a comprehensive outlook on the possible stock price movement in the coming days. By examining these key indicators, we aim to offer valuable insights and predictions for potential investors.
Trend Analysis:
- Moving Averages (MA): The 5-day Moving Average (MA) has been trending slightly above the Simple Moving Average (SMA) and Exponential Moving Average (EMA), indicating a short-term bullish trend.
- MACD: The Moving Average Convergence Divergence (MACD) has shown positive values, with the MACD line consistently above the Signal line, suggesting a bullish momentum.
- RSI: The Relative Strength Index (RSI) has been fluctuating around the neutral zone, indicating a balanced market sentiment.
Momentum Analysis:
- Stochastic Oscillator: The Stochastic Oscillator has been hovering in the overbought territory, suggesting a potential reversal or consolidation phase.
- Williams %R: The Williams %R indicator has been in the oversold region, signaling a possible buying opportunity.
Volatility Analysis:
- Bollinger Bands (BB): The Bollinger Bands have shown a narrowing of the bands, indicating decreasing volatility and a potential price breakout in the near future.
Volume Analysis:
- On-Balance Volume (OBV): The OBV indicator has been relatively stable, reflecting consistent buying pressure in the stock.
- Chaikin Money Flow (CMF): The CMF has been positive, indicating strong accumulation in the stock.
Key Observations:
- The trend indicators suggest a bullish bias in the short term, supported by positive MACD values and a slightly upward trending MA.
- Momentum indicators show conflicting signals with the Stochastic Oscillator in the overbought zone and the Williams %R in the oversold region.
- Volatility is decreasing as indicated by the narrowing Bollinger Bands, hinting at a potential price breakout.
- Volume indicators reflect consistent buying pressure and accumulation in the stock.
Conclusion:
Based on the analysis of the technical indicators, the stock is likely to experience a short-term upward movement in the coming days. The bullish trend indicated by the MA and MACD, coupled with stable volume accumulation, supports this view. However, caution is advised due to conflicting signals from the momentum indicators, suggesting a possible consolidation or minor pullback before resuming the upward trajectory. Traders may consider entering long positions with proper risk management strategies in place to capitalize on the expected price appreciation.