Technical Analysis of OWNS 2024-05-10
Overview:
In analyzing the technical indicators for OWNS stock over the last 5 days, we will delve into the trend, momentum, volatility, and volume indicators to provide a comprehensive outlook on the possible stock price movement in the coming days. By examining these key indicators, we aim to offer valuable insights and predictions for informed decision-making.
Trend Analysis:
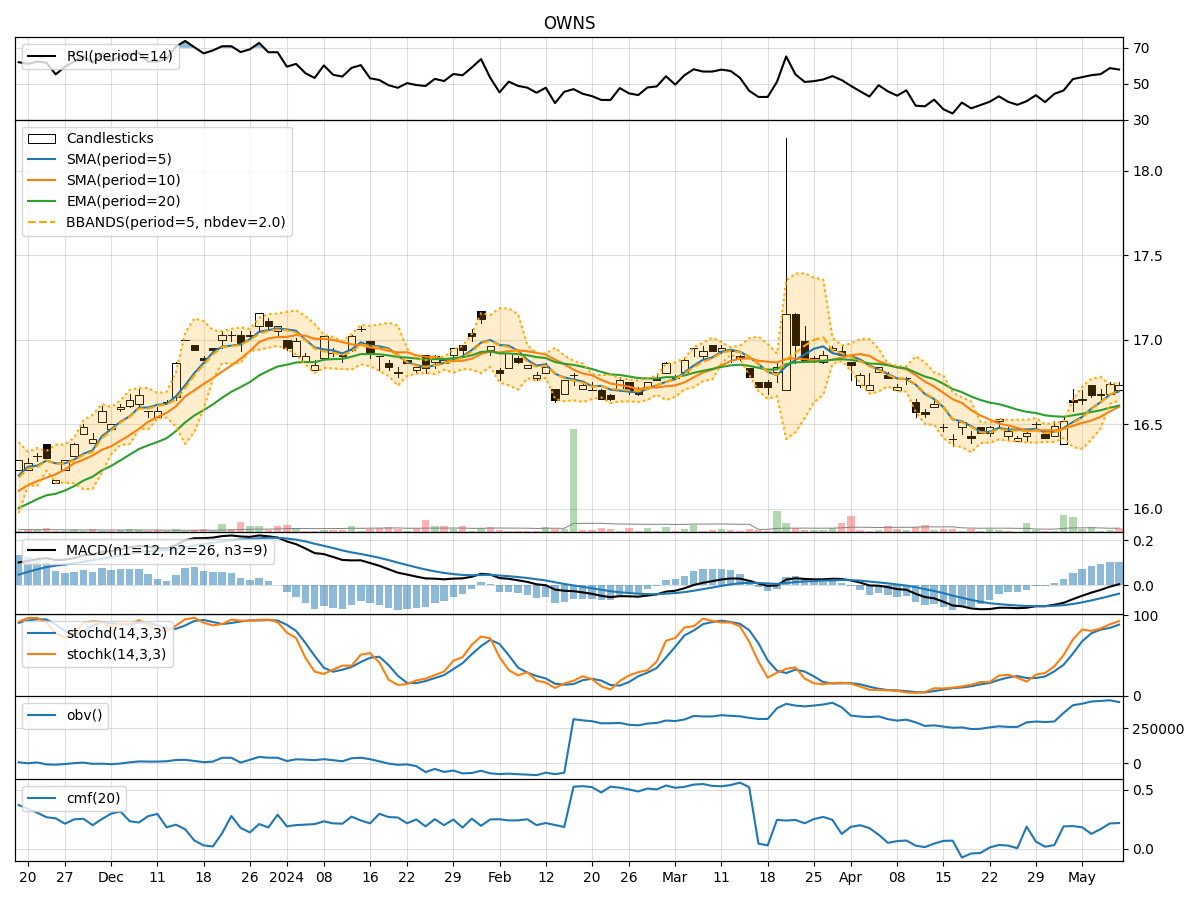
- Moving Averages (MA): The 5-day Moving Average (MA) has been consistently above the Simple Moving Average (SMA) and Exponential Moving Average (EMA), indicating a short-term bullish trend.
- MACD: The MACD line has been positive, with the MACD Histogram showing an increasing trend, suggesting bullish momentum.
Momentum Analysis:
- RSI: The Relative Strength Index (RSI) has been in the neutral zone around 50-60, indicating a balanced momentum.
- Stochastic Oscillator: Both %K and %D have been in the overbought region, signaling a potential reversal or consolidation.
Volatility Analysis:
- Bollinger Bands (BB): The stock price has been trading within the Bollinger Bands, with the bands narrowing, indicating decreasing volatility.
Volume Analysis:
- On-Balance Volume (OBV): The OBV has shown a slight increase, suggesting accumulation by investors.
- Chaikin Money Flow (CMF): The CMF has been positive, indicating buying pressure in the stock.
Key Observations:
- The trend indicators suggest a bullish sentiment in the short term.
- Momentum indicators show a potential overbought condition, signaling a need for caution.
- Volatility has been decreasing, indicating a possible period of consolidation.
- Volume indicators point towards accumulation and positive buying pressure.
Conclusion:
Based on the analysis of the technical indicators, the next few days for OWNS stock are likely to see sideways movement with a slight bullish bias. Traders should be cautious of the potential overbought condition indicated by the momentum indicators and monitor for any signs of reversal. The decreasing volatility suggests a period of consolidation, while the positive OBV and CMF indicate underlying strength in the stock. Overall, a cautiously bullish view is recommended for the next few days.