Effortless Technical Analysis at Your Fingertips: Essential Insights for Investors and Traders (Early Access)
Technical analysis is an essential tool for investors and traders alike, providing insights into market trends and potential price movements. This report delves into the various aspects of technical analysis, focusing on key indicators that are widely used by market participants to make informed decisions.
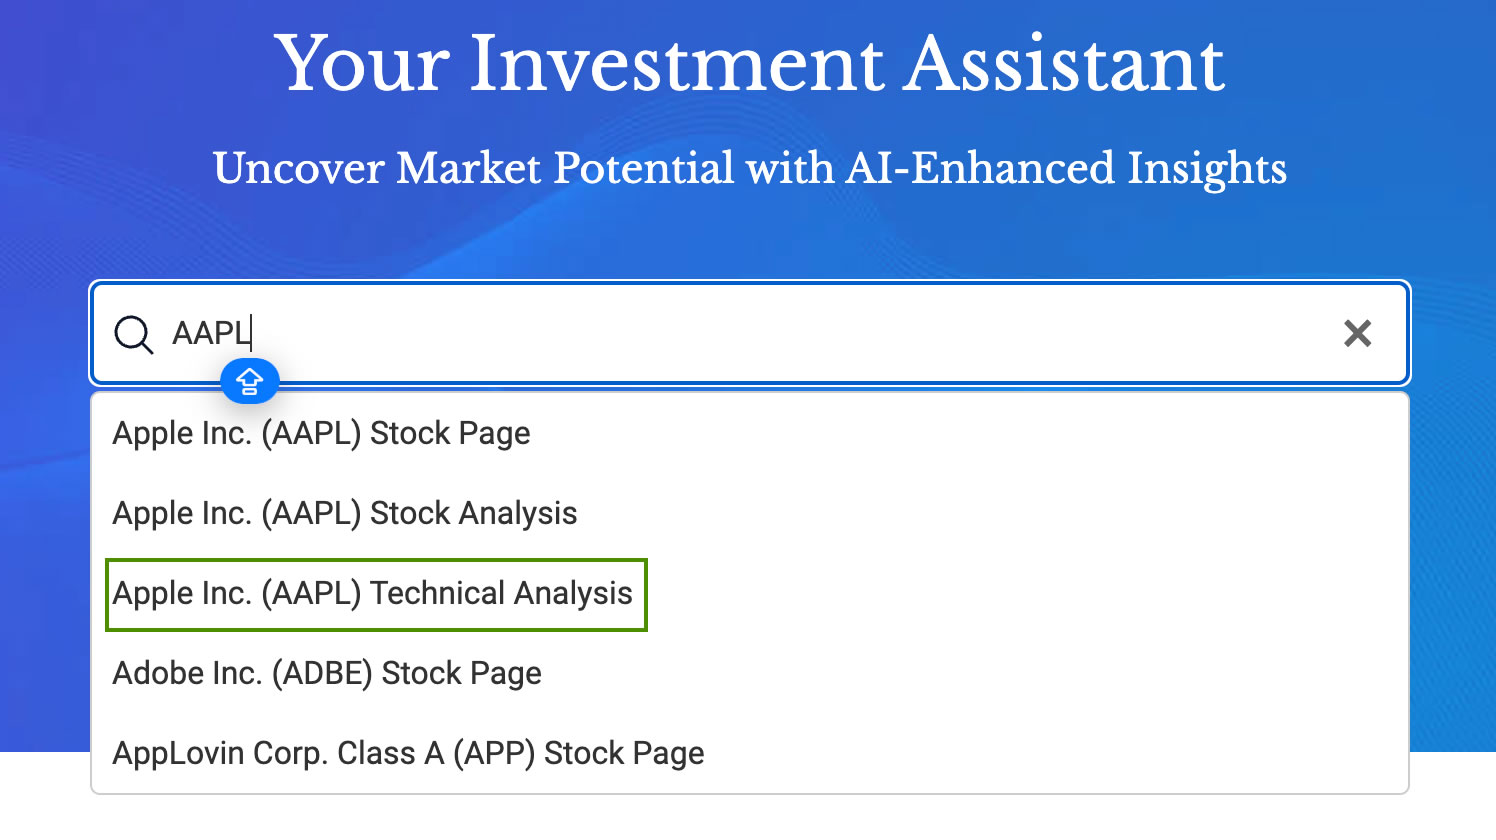
Easily access in-depth stock insights by simply typing your desired analysis in the search box at kavout.com homepage, like “Apple technical analysis” or “AAPL short-term trend.” Our platform provides a detailed technical analysis of the stock’s short-term performance, eliminating the need for you to remember intricate indicator interpretations or complex calculations. Gain immediate access to crucial insights and expert technical analysis, empowering you to make more informed investment decisions.
Go to stock technical analysis:
AAPL technical analysis MSFT technical analysis AMD trend analysis
Understanding Technical Analysis
Technical analysis is a method of evaluating securities by analyzing statistics generated by market activity, such as past prices and volume. Unlike fundamental analysis, which looks at economic factors and company metrics, technical analysis focuses on the study of market action through chart analysis, patterns, and indicators. The primary assumption behind technical analysis is that all known information is already reflected in the price, and that prices move in trends.
Key Technical Indicators
There are numerous technical indicators that traders and investors use to gauge market sentiment and forecast future price movements. Here are some of the most significant ones:
Moving Averages
Moving averages are among the most popular technical indicators. They smooth out price data to create a single flowing line, which makes it easier to identify the direction of the trend. The two most common types are the Simple Moving Average (SMA) and the Exponential Moving Average (EMA). The SMA calculates the average price over a specific time period, while the EMA gives more weight to recent prices.
Relative Strength Index (RSI)
The Relative Strength Index (RSI) is a momentum oscillator that measures the speed and change of price movements. It oscillates between zero and 100. Traditionally, and according to Wilder, RSI is considered overbought when above 70 and oversold when below 30.
Moving Average Convergence Divergence (MACD)
The Moving Average Convergence Divergence (MACD) is a trend-following momentum indicator that shows the relationship between two moving averages of a security’s price. The MACD is calculated by subtracting the 26-period EMA from the 12-period EMA.
Bollinger Bands
Bollinger Bands are a volatility indicator created by John Bollinger. They consist of a middle band being an N-period simple moving average (SMA), an upper band at K times an N-period standard deviation above the middle band, and a lower band at K times an N-period standard deviation below the middle band.
Stochastic Oscillator
The Stochastic Oscillator is a momentum indicator comparing a particular closing price of a security to a range of its prices over a certain period. The sensitivity of the oscillator to market movements is reducible by adjusting that time period or by taking a moving average of the result.
It consists of two lines, the %K (main line) and the %D (signal line), which can signal potential buy or sell opportunities. The Stochastic Oscillator ranges from 0 to 100, with readings above 80 considered overbought and readings below 20 considered oversold.
On-Balance Volume (OBV)
The On-Balance Volume (OBV) indicator is a momentum indicator that uses volume flow to predict changes in stock price. The core premise of OBV is that volume precedes price movement, making it a leading indicator that can signal bullish or bearish outcomes. The OBV is calculated by adding the day’s volume to a cumulative total when the security’s price closes up, and subtracting the day’s volume when the security’s price closes down.
Chaikin Money Flow (CMF)
Developed by Marc Chaikin, the Chaikin Money Flow (CMF) indicator measures the amount of Money Flow Volume over a specific period. It combines price and volume to measure the buying and selling pressure for a given period and is typically set to 20 or 21 days.
The CMF is calculated by summing Money Flow Volume for a specific look-back period and dividing by the total volume for the same period. The CMF value oscillates between 1 and -1, with values above zero indicating buying pressure and values below zero indicating selling pressure. A positive CMF would suggest that buyers are in control and the price may increase, whereas a negative CMF indicates that sellers could drive the price lower.
Applying Technical Analysis
Investors and traders use these indicators to make decisions about entry and exit points for their trades. For instance, a trader might buy a stock when its RSI moves out of the oversold region, indicating a potential upward price movement. Similarly, an investor might use moving averages to determine the long-term trend of a stock and make a decision to hold or sell based on the direction of the trend.
The OBV’s focus on volume and price action makes it a valuable tool for gauging the strength behind price movements. The CMF’s ability to measure buying and selling pressure over a set period can help traders identify potential reversals or confirm trends. Lastly, the Stochastic Oscillator’s sensitivity to market movements enables traders to spot overbought or oversold conditions, potentially leading to profitable entry or exit points.
Conclusion
In conclusion, technical analysis is a powerful tool for investors and traders, offering a variety of indicators and methods to analyze market trends and make trading decisions. The combination of these indicators can provide a robust framework for making informed trading decisions. For instance, a trader might look for scenarios where the OBV is rising, the CMF is above zero, and the Stochastic Oscillator has just crossed above the oversold threshold. Such a confluence of signals could suggest a strong buying opportunity.
It is crucial, however, to remember that no technical indicator is infallible. Each indicator’s signals should be corroborated with additional analysis, whether it be other technical indicators, fundamental analysis, or economic indicators. Market conditions can change rapidly, and indicators that worked well in the past may not always predict future movements accurately. Investors and traders must remain aware of the limitations of technical analysis and use it as one of several tools in their investment toolkit.
If you have any questions or feedback, please send us email: contact@kavout.co
Send us a Message
Contact us
Contact us today to learn more about Kavout's products or services.