K Score – Pioneer in Machine Learning Signal
Predictive power by big data and perpetual deep leaning
Why K Score
On any given day, Kavout processes millions of diverse data sets, and runs models encompassing many traditional and advanced financial engineering methods such as regression, classification, deep learning, and reinforcement learning to produce a predictive rating to rank stocks.
Quantamental Strategy
Pairing fundamental research with data-driven quantitative analysis, K Score integrates technical concepts, statistical analysis and machine learning ranking algorithms, arriving at an easy-to-understand and actionable equity rating score of 1-to-9.

Vast and Diverse Data Sets and Factors
We rank more than 200 factors including company fundamentals, pricing and trading volume data, technical indicators such as RSI and Z Score, as well as alternative data such as sentiment to arrive at a rating for thousands of stocks around the globe.
Beyond Traditional Financial Analysis
K Score is a result of synthesizing voluminous and complex signals every day at scale and applying deep learning methods to capture nonlinear relationships and correlations. No human investor could match the speed and scale of our advanced computing capabilities.
Your Return on Investment
K Scores can be effective signals generating incremental alpha overlay with your systematic and quantitative models. For as low as 0.02% of your fund profit, the annual subscription gives managers daily data-feed and an estimated alpha of 4.84%.
| Fund AUM | Est. K Score Alpha* | Est. Profit from K Score Alpha | K Score Fee as a % of Fund Profit |
|---|---|---|---|
| Up to $50M USD | 4.84% | $2.42M USD | 0.50% – 0.65% |
| $50M – $100M USD | 4.84% | $4.84M USD | 0.40% – 0.52% |
| $100 – $500M USD | 4.84% | $24.2M USD | 0.11% – 0.15% |
| $500M – $1B USD | 4.84% | $48.4M USD | 0.08% – 0.10% |
| $5B USD and up | 4.84% | $242M USD | 0.02% – 0.04% |
* K Score alpha is an estimate only. Actual alpha results may vary.
How to Use K Score
K Scores can be delivered daily via FTP, API or any format that works best with your data pipeline.
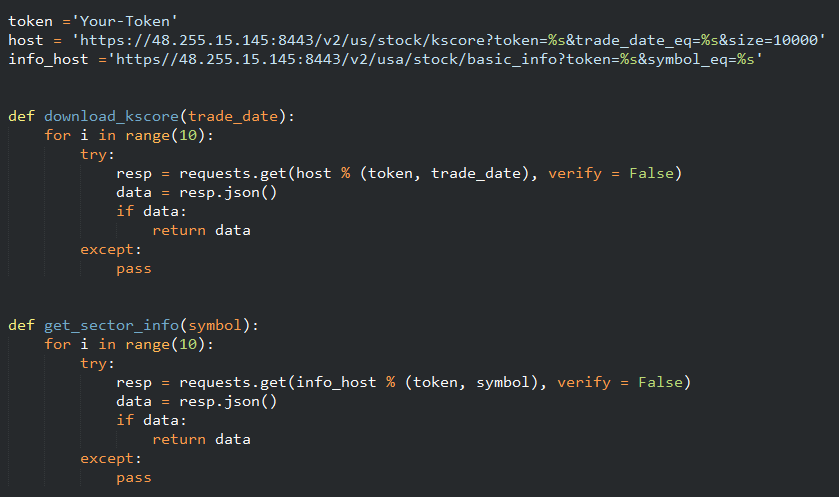
Alpha signals for your privately developed quant models.
- FREE 7-years of historic data for back testing
- Data delivered via FTP, API or CSV
- Monthly data subscription
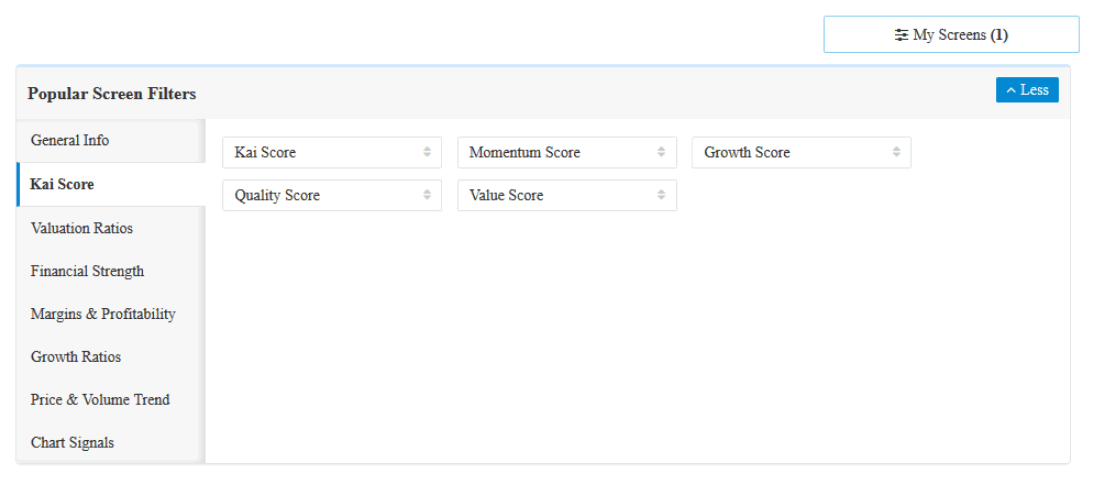
Screen for new long ideas
Mitigate risk by researching stocks with low K Scores.
- Data delivered to you via CSV and FTP
- Upload datasets into your own tools – Screener, Excel or other
- Monthly or quarterly subscription
Direct indexing. Take back control with portfolios out-perform ETFs and index.
- Develop your own portfolio strategy using K Score
- Work with Kavout to research, test and create solutions for your clients.
K Score Coverage
Customers can choose one or many options from a series of K Score products.
Contact us
Contact us today to learn more about Kavout's products or services.