


News•16 hours ago
Review & Preview: ‘One Big Global Trade'
S&P 500 saw 71% of stocks rise, but an 11% plunge in South Korea's main index dragged on the Nasdaq.
On Friday, June 21, 2019, FTSE Russell, a leading global multi-asset index, data and analytics provider, announced that China A-Shares will be added to its popular global benchmarks. This comes on the heels of one of their largest competitors, MSCI announcing on February 28, 2019 they would be increasing their weighting of China A-Shares. By November 2019, the total weighting in the MSCI index for offshore and domestic Chinese stocks will be approximately 34.4% – the largest country weight by a significant margin. Having two of the most well-known global indexes focusing on the Chinese market will feed the curiosity of global investors in a market that has been marked with massive potential, but also shrouded with mystery.
This is the latest validation after years of the Chinese stock market opening up to foreign investment and loosening restrictions. Despite recent headlines, China remains one of the greatest growth stories since the early 1980s, and their equity market accounts for nearly 30% of the emerging market. Simply put – China is too big to ignore. And while the intent is being welcomed by the global investor community, details are slowly being released on what that opportunity will look like, likely to not be fully realized until 2020.
What makes up the China A-Share stock market? It is comprised of two exchanges – the Shanghai stock exchange (SSE) and Shenzhen stock exchange (SZSE). The SSE is the world’s 4th largest stock market by market capitalization at US$5.01 trillion as of May 2019. The combined market capitalization of the listed companies on the SZSE is US$3.51 trillion. It is the 8th largest stock exchange in the world, and the 4th largest in Asia.
The most important Indices in China A-share are CSI 300, CSI 500 and CSI 800.
Data on China A-Shares is limited to come across, let alone information that is dependable, deep, and crosses cultural and language barriers. This is compounded with a market that is marked by overall market volatility, official intervention in state-owned enterprises, and the liquidity of the Connect programs.
With corporate operations in Beijing and Shanghai, Kavout’s financial engineering team has boots on the ground in China. Given our international coverage and unique data sources, we are able to overcome the major issues typically associated with obtaining information about China A-Share.
Whether a portfolio manager has a long/short strategy, or analysts and researchers search for quantitative signals, Kavout’s K Scores – a predictive analytics rating system that grades stocks between the value of 1 to 9, indicate probability for a given stock to outperform (K Score of 9) or underperform (K Score of 1) the market.
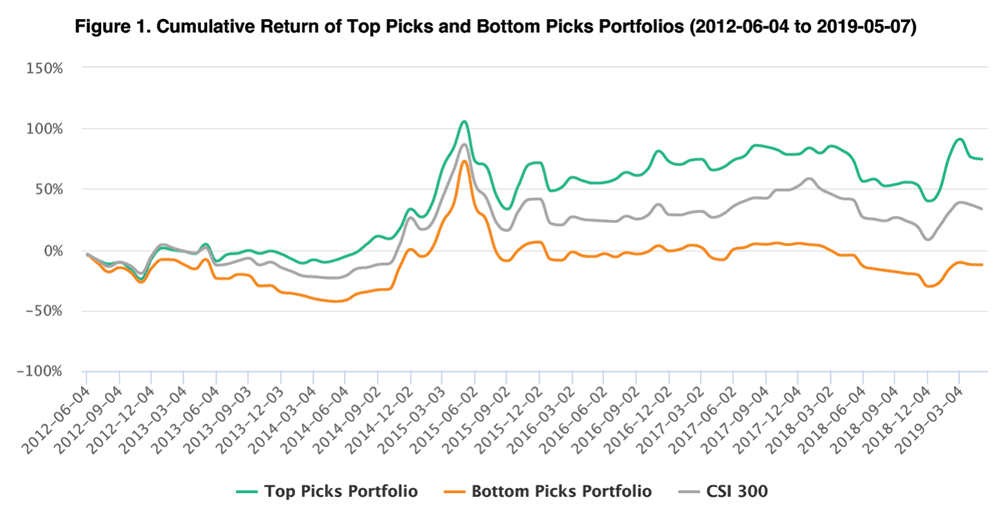
To demonstrate below are two portfolios called Top Picks and Bottom Picks. Top Picks portfolio consists of stocks in K Score of 9, and Bottom Picks portfolio consists of stocks in K Score of 1. As we can see in Figure 1, the Top Picks portfolio, which consists of 9 K Scores, has generated a cumulative return of 74.75% from 2012-06-04 to 2019-05-07. Over the same period of time the Bottom Picks portfolio, which consists of stocks with stocks in K Score of 1, has generated only a -12.39% cumulative return. The CSI 300 benchmark has a cumulative return of 33.58% over this time period.
Click below to learn more about K Score for China A-Share and how we can find alpha in the world’s largest emerging market.