Introducing New Beta Features: Discover Stock Ideas with Chart and Candlestick Patterns
We are thrilled to announce the launch of our latest features designed to empower investors and traders like you. We understand the importance of identifying potential investment opportunities, and that’s why we have integrated advanced tools for recognizing chart patterns and candlestick patterns. Our cutting-edge technology analyzes vast amounts of data to identify stocks that exhibit popular patterns such as Head and Shoulders, Cup and Handle, Triangles, Wedges, Hammers, Engulfing patterns, and more.
Samples stock screens:
Chart Patterns
Stock chart patterns are graphical representations of price movements in a stock over a specific period. These patterns are used by traders and investors to analyze market trends, identify potential buying or selling opportunities, and make informed trading decisions. Chart patterns can be found in various timeframes, from intraday to weekly or monthly charts.
Chart patterns are formed by the interaction of supply and demand forces in the market and can indicate potential trend continuations, reversals, or breakouts. Recognizing and interpreting these patterns can help traders anticipate future price movements and manage their risk accordingly.
Here are some of the popular chart patterns:
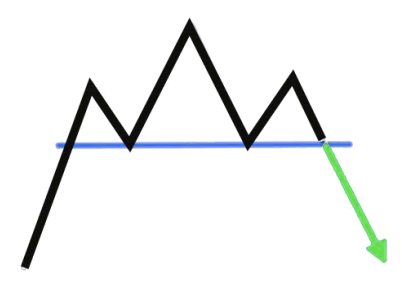
Head and Shoulders: This pattern consists of three peaks, with the middle peak (head) being the highest and the two outside peaks (shoulders) being lower and roughly equal. It indicates a potential trend reversal from bullish to bearish.
 | Find stocks with Head & Shoulders |
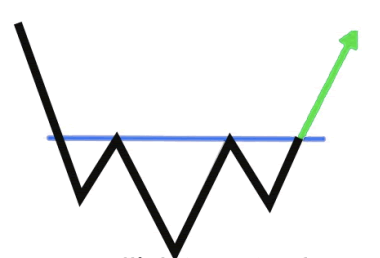
Inverse Head and Shoulders: This pattern is the opposite of the Head and Shoulders, with the middle trough being the lowest and the two outside troughs being higher and roughly equal. It indicates a potential trend reversal from bearish to bullish.
 | Find Inverse Head and Shoulders stocks |
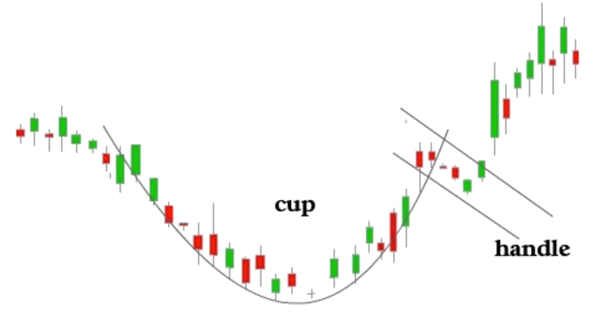
Cup and Handle: This pattern resembles a cup with a handle on the right side. It starts with a downtrend, followed by a gradual recovery (cup) and a slight downward drift (handle) before breaking out to the upside.
 | Find Cup and Handle stocks |
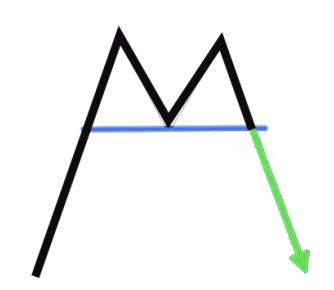
Double Top and Double Bottom: These patterns occur when the price reaches the same level twice, either at a high (Double Top) or a low (Double Bottom), and then reverses direction, indicating a potential trend reversal.
 | Double Top stocks |
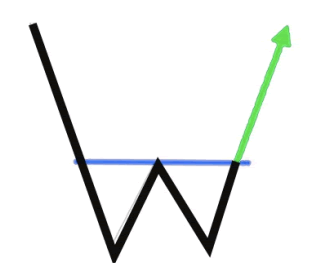 | Double Bottom stocks |
Flag: These are continuation patterns that consist of a sharp price move (flagpole) followed by a consolidation period (flag) and a subsequent breakout in the direction of the initial trend.
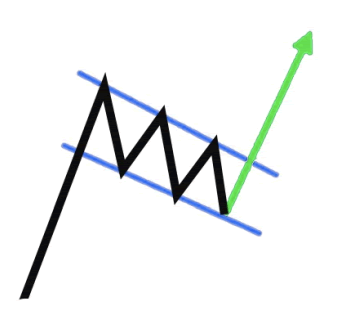 | Find stocks with bull flag |
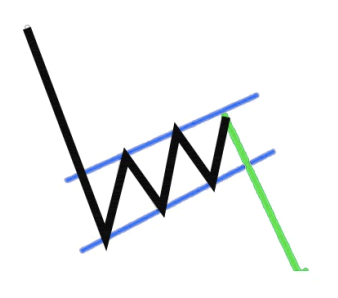 | Find stocks with bear flag |
Round Bottom: Also known as a Saucer Bottom or a Rounding Bottom, this is a long-term reversal pattern that indicates a gradual shift from a bearish to a bullish trend. It is characterized by a series of price movements that form a “U” shape on the chart, with a gradual decline, stabilization, and eventual rise in price.
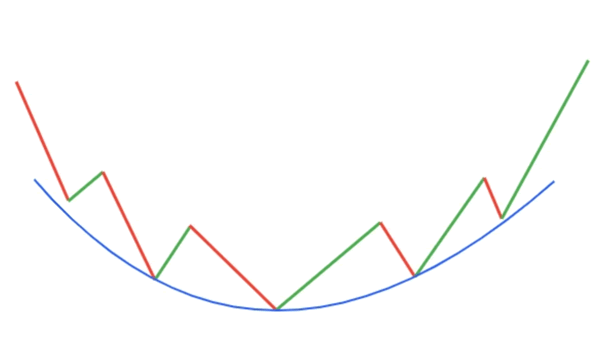 | Find Round Bottom stocks |
Candlestick Patterns
Candlestick patterns are another essential tool for technical analysis in trading. These patterns can provide insights into market sentiment and potential trend reversals or continuations. Here are some popular candlestick patterns, categorized by their implications:
Here are some of the popular candlestick patterns:
Bullish Reversal Patterns:
- Hammer: This pattern forms when the price drops significantly lower than the opening price but then rallies back to close near the opening price, creating a hammer-like shape with a long lower wick and a small body.
- Bullish Engulfing: This pattern consists of two candles, where the second candle completely engulfs the first candle’s body. It indicates a potential bullish reversal after a downtrend.
- Morning Star: A three-candle pattern that starts with a long bearish candle, followed by a small-bodied candle (either bullish or bearish) that gaps down, and then a long bullish candle that closes above the midpoint of the first candle, indicating a potential bullish reversal.
Bearish Reversal Patterns:
- Shooting Star: This pattern is the bearish equivalent of the Inverted Hammer, with a long upper wick and a small body, indicating a potential bearish reversal after an uptrend.
- Hanging Man: Similar to the Hammer, but it appears after an uptrend and suggests a potential bearish reversal.
- Bearish Engulfing: The bearish counterpart to the Bullish Engulfing pattern, where a larger bearish candle engulfs the previous bullish candle, indicating a potential bearish reversal.
- Dark Cloud Cover: This two-candle pattern occurs when a bearish candle opens above the previous day’s close but then closes below the midpoint of the previous bullish candle, suggesting a potential bearish reversal.
- Evening Star: The bearish equivalent of the Morning Star, consisting of a long bullish candle, followed by a small-bodied candle that gaps up, and then a long bearish candle that closes below the midpoint of the first candle, indicating a potential bearish reversal.
Continuation Patterns:
- Doji: A candle with a very small or non-existent body, indicating indecision in the market. Depending on the context, a Doji can suggest a potential trend reversal or continuation.
- Spinning Top: Similar to a Doji, but with slightly longer upper and lower wicks, also indicating market indecision.
- Marubozu: A candle with no wicks (or very small wicks), suggesting strong buying or selling pressure. A bullish Marubozu has a long white body, while a bearish Marubozu has a long black body.
Indecision Patterns:
- Harami: A two-candle pattern where a small-bodied candle is contained within the previous candle’s body, indicating a potential pause in the current trend and a possible reversal.
- Tweezers: These patterns occur when two or more candles have matching highs (Tweezer Tops) or lows (Tweezer Bottoms), suggesting a potential trend reversal due to indecision in the market.
As with chart patterns, candlestick patterns should be used in conjunction with other technical analysis tools, such as support and resistance levels, volume analysis, and indicators. Confirm the patterns with additional evidence before making trading decisions, and always consider the overall market context.
Conclusion
Recognizing stock chart patterns is an essential skill for traders, providing valuable clues about future price movements. Patterns like Bull and Bear Flags, Head and Shoulders, Ascending Triangles, Cup and Handle, and Pennants are among the most common and offer various strategies for trading. It’s important for traders to consider the context in which these patterns form, the volume during the pattern formation and breakout, and to use appropriate risk management techniques.
In this exciting update, Kavout has launched features that empower our users to effortlessly discover stock ideas based on chart and candlestick patterns. Our platform now automatically scans the market, identifying stocks that exhibit popular and profitable patterns. From classic chart patterns like Head and Shoulders, Cup and Handle, and Triangles, to powerful candlestick patterns such as Hammers, Engulfing patterns, and Morning Stars, our users can now access a wealth of potential investment opportunities at their fingertips.
This innovative tool eliminates the need for manual chart analysis, saving valuable time and effort while providing data-driven insights for making informed trading decisions. Whether you’re a seasoned trader or new to the world of investing, this feature will help you stay ahead of the market and capitalize on promising stock ideas, and unlock the potential of chart and candlestick patterns like never before.
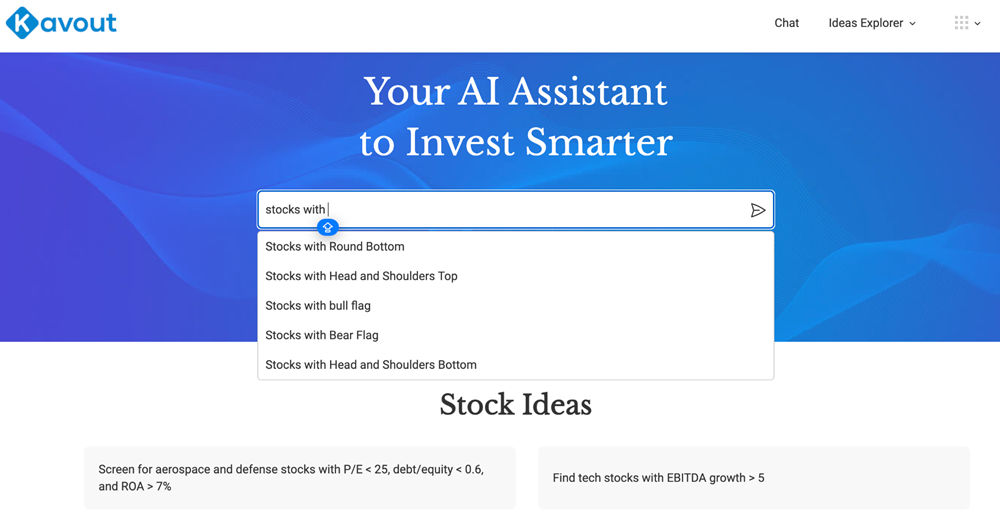
Go to kavout.com, in the input box, type pattern keywords or explore with sample stock ideas to get started.
Send us a Message
Contact us
Contact us today to learn more about Kavout's products or services.